DIRECTV 2009 Annual Report Download - page 69
Download and view the complete annual report
Please find page 69 of the 2009 DIRECTV annual report below. You can navigate through the pages in the report by either clicking on the pages listed below, or by using the keyword search tool below to find specific information within the annual report.-
 1
1 -
2
-
3
-
4
-
5
-
6
-
7
-
8
-
9
-
10
-
11
-
12
-
13
-
14
-
15
-
16
-
17
-
18
-
19
-
20
-
21
-
22
-
23
-
24
-
25
-
26
-
27
-
28
-
29
-
30
-
31
-
32
-
33
-
34
-
35
-
36
-
37
-
38
-
39
-
40
-
41
-
42
-
43
-
44
-
45
-
46
-
47
-
48
-
49
-
50
-
51
-
52
-
53
-
54
-
55
-
56
-
57
-
58
-
 59
59 -
 60
60 -
 61
61 -
 62
62 -
 63
63 -
 64
64 -
 65
65 -
 66
66 -
 67
67 -
 68
68 -
 69
69 -
 70
70 -
 71
71 -
 72
72 -
 73
73 -
 74
74 -
 75
75 -
 76
76 -
 77
77 -
 78
78 -
 79
79 -
80
-
81
-
82
-
83
-
84
-
85
-
86
-
87
-
88
-
89
-
90
-
91
-
92
-
93
-
94
-
95
-
96
-
97
-
98
-
99
-
100
-
101
-
102
-
103
-
104
-
105
-
106
-
107
-
108
-
109
-
110
-
111
-
112
-
113
-
114
-
115
-
116
-
117
-
118
-
119
-
120
-
121
-
122
-
123
-
124
-
125
-
126
-
127
-
128
-
129
-
130
-
131
-
132
-
133
-
134
-
135
-
136
-
137
-
138
-
139
-
140
-
141
-
142
-
143
-
144
-
145
-
146
-
147
-
148
-
149
-
150
-
151
-
152
-
153
-
154
-
155
-
156
-
157
-
158
-
159
-
160
 |
 |

DIRECTV
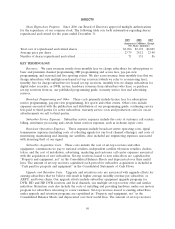
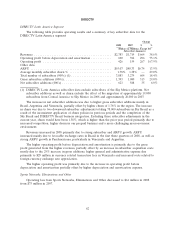
DIRECTV Latin America Segment
The following table provides operating results and a summary of key subscriber data for the
DIRECTV Latin America segment:
Change
2009 2008 $ %
(Dollars in Millions, Except Per
Subscriber Amounts)
Revenues ............................................ $2,878 $2,383 $ 495 20.8%
Operating profit before depreciation and amortization ............ 697 690 7 1.0%
Operating profit ....................................... 331 426 (95) (22.3)%
Other data:
ARPU .............................................. $57.12 $55.07 $2.05 3.7%
Average monthly subscriber churn % (1) ...................... 1.75% 1.78% — (1.7)%
Total number of subscribers (000’s) (2) ....................... 4,588 3,883 705 18.2%
Gross subscriber additions (000’s) ........................... 1,575 1,393 182 13.1%
Net subscriber additions (000’s) ............................ 692 623 69 11.1%
(1) In the year ended December 31, 2008, DIRECTV Latin America had a subscriber adjustment
totaling 78,000 subscribers in Sky Brazil as a result of the inconsistent application of churn policies
in previous periods and the completion of the Sky Brazil and DIRECTV Brazil business
integration.
(2) DIRECTV Latin America subscriber data excludes subscribers of the Sky Mexico platform. We
migrated approximately 3,000 subscribers from DIRECTV Latin America to Sky Mexico during
2009 and migrated approximately 19,000 subscribers from DIRECTV Latin America to Sky Mexico
during 2008. Additionally, we migrated approximately 16,000 subscribers from a local pay television
service provider in Latin America to Sky Brazil during 2009. Net subscriber additions as well as
churn exclude the effect of these migrations.
The increase in net subscriber additions was due to strong subscriber demand across the region,
particularly in Colombia, Brazil and Puerto Rico, increased demand for DVR, HD and pre-paid
services, as well as targeted customer promotions. The decrease in average monthly subscriber churn
was primarily due to two downward subscriber adjustments in 2008 totaling 78,000 subscribers.
Excluding these subscriber adjustments, churn would have increased 17 basis points principally due to
the growth of DTVLA’s prepaid business.
Revenues increased in 2009 primarily due to strong subscriber and ARPU growth. ARPU
increased mainly due to price increases in Venezuela, Brazil and Argentina, as well as higher fees for
HD and DVR services, partially offset by foreign currency devaluations, particularly in Brazil and
Argentina.
The higher operating profit before depreciation and amortization is primarily due to the gross
profit generated from the higher revenues, partially offset by higher general and administrative expense
due primarily to $213 million in currency related transaction fees in Venezuela, an increase in
subscriber acquisition costs mostly due to an increase in gross subscriber additions and higher
subscriber service costs primarily related to customer service improvement initiatives and the larger
subscriber base.
57