DIRECTV 2009 Annual Report Download - page 54
Download and view the complete annual report
Please find page 54 of the 2009 DIRECTV annual report below. You can navigate through the pages in the report by either clicking on the pages listed below, or by using the keyword search tool below to find specific information within the annual report.-
 1
1 -
2
-
3
-
4
-
5
-
6
-
7
-
8
-
9
-
10
-
11
-
12
-
13
-
14
-
15
-
16
-
17
-
18
-
19
-
20
-
21
-
22
-
23
-
24
-
25
-
26
-
27
-
28
-
29
-
30
-
31
-
32
-
33
-
34
-
35
-
36
-
37
-
38
-
39
-
40
-
41
-
42
-
43
-
 44
44 -
 45
45 -
 46
46 -
 47
47 -
 48
48 -
 49
49 -
 50
50 -
 51
51 -
 52
52 -
 53
53 -
 54
54 -
 55
55 -
 56
56 -
 57
57 -
 58
58 -
 59
59 -
 60
60 -
 61
61 -
 62
62 -
 63
63 -
 64
64 -
65
-
66
-
67
-
68
-
69
-
70
-
71
-
72
-
73
-
74
-
75
-
76
-
77
-
78
-
79
-
80
-
81
-
82
-
83
-
84
-
85
-
86
-
87
-
88
-
89
-
90
-
91
-
92
-
93
-
94
-
95
-
96
-
97
-
98
-
99
-
100
-
101
-
102
-
103
-
104
-
105
-
106
-
107
-
108
-
109
-
110
-
111
-
112
-
113
-
114
-
115
-
116
-
117
-
118
-
119
-
120
-
121
-
122
-
123
-
124
-
125
-
126
-
127
-
128
-
129
-
130
-
131
-
132
-
133
-
134
-
135
-
136
-
137
-
138
-
139
-
140
-
141
-
142
-
143
-
144
-
145
-
146
-
147
-
148
-
149
-
150
-
151
-
152
-
153
-
154
-
155
-
156
-
157
-
158
-
159
-
160
 |
 |

DIRECTV
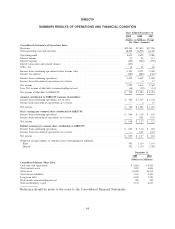
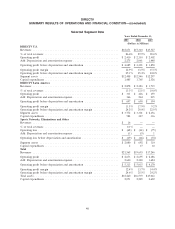
ITEM 6. SELECTED FINANCIAL DATA
Years Ended and As of December 31,
2009 2008 2007 2006 2005
(Dollars in Millions, Except Per Share Amounts)
Consolidated Statements of Operations Data:
Revenues ................................ $21,565 $19,693 $17,246 $14,755 $13,164
Total operating costs and expenses .............. 18,892 16,998 14,760 12,398 12,531
Operating profit ........................... $ 2,673 $ 2,695 $ 2,486 $ 2,357 $ 633
Income from continuing operations attributable to
DIRECTV ............................. $ 942 $ 1,515 $ 1,434 $ 1,420 $ 305
Income from discontinued operations, net of taxes
attributable to DIRECTV .................. — 6 17 — 31
Net income attributable to DIRECTV ........... $ 942 $ 1,521 $ 1,451 $ 1,420 $ 336
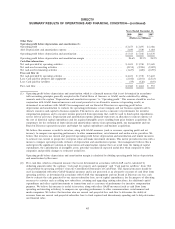
Basic earnings per common share:
Income from continuing operations attributable to
DIRECTV ............................. $ 0.96 $ 1.36 $ 1.20 $ 1.13 $ 0.22
Diluted earnings per common share:
Income from continuing operations attributable to
DIRECTV ............................. $ 0.95 $ 1.36 $ 1.20 $ 1.12 $ 0.22
Weighted average number of common shares
outstanding (in millions):
Basic ................................... 985 1,110 1,195 1,262 1,388
Diluted ................................. 992 1,114 1,202 1,270 1,395
Consolidated Balance Sheet Data:
Total assets .............................. $18,260 $16,539 $15,063 $15,141 $15,630
Obligations under capital leases ................ 586 584 57 91 80
Long-term debt ........................... 6,500 5,725 3,347 3,395 3,405
Total stockholders’ equity .................... 2,911 4,631 6,013 6,473 7,989
See the Notes to the Consolidated Financial Statements and Management’s Discussion and Analysis of
Financial Condition and Results of Operations for additional information regarding other significant
transactions during each of the three years in the period ended December 31, 2009.
***
42