DIRECTV 2009 Annual Report Download - page 103
Download and view the complete annual report
Please find page 103 of the 2009 DIRECTV annual report below. You can navigate through the pages in the report by either clicking on the pages listed below, or by using the keyword search tool below to find specific information within the annual report.-
 1
1 -
2
-
3
-
4
-
5
-
6
-
7
-
8
-
9
-
10
-
11
-
12
-
13
-
14
-
15
-
16
-
17
-
18
-
19
-
20
-
21
-
22
-
23
-
24
-
25
-
26
-
27
-
28
-
29
-
30
-
31
-
32
-
33
-
34
-
35
-
36
-
37
-
38
-
39
-
40
-
41
-
42
-
43
-
44
-
45
-
46
-
47
-
48
-
49
-
50
-
51
-
52
-
53
-
54
-
55
-
56
-
57
-
58
-
59
-
60
-
61
-
62
-
63
-
64
-
65
-
66
-
67
-
68
-
69
-
70
-
71
-
72
-
73
-
74
-
75
-
76
-
77
-
78
-
79
-
80
-
81
-
82
-
83
-
84
-
85
-
86
-
87
-
88
-
89
-
90
-
91
-
92
-
 93
93 -
 94
94 -
 95
95 -
 96
96 -
 97
97 -
 98
98 -
 99
99 -
 100
100 -
 101
101 -
 102
102 -
 103
103 -
 104
104 -
 105
105 -
 106
106 -
 107
107 -
 108
108 -
 109
109 -
 110
110 -
 111
111 -
 112
112 -
 113
113 -
114
-
115
-
116
-
117
-
118
-
119
-
120
-
121
-
122
-
123
-
124
-
125
-
126
-
127
-
128
-
129
-
130
-
131
-
132
-
133
-
134
-
135
-
136
-
137
-
138
-
139
-
140
-
141
-
142
-
143
-
144
-
145
-
146
-
147
-
148
-
149
-
150
-
151
-
152
-
153
-
154
-
155
-
156
-
157
-
158
-
159
-
160
 |
 |

DIRECTV
NOTES TO THE CONSOLIDATED FINANCIAL STATEMENTS—(continued)
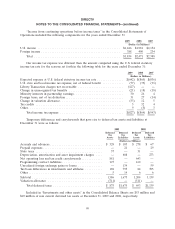
We capitalized interest costs of $18 million in 2009, $18 million in 2008, and $51 million in 2007 as
part of the cost of our property and satellites under construction. Depreciation expense was
$2,287 million in 2009, $1,907 million in 2008, and $1,264 million in 2007.
On March 1, 2006, DIRECTV U.S. introduced a set-top receiver lease program. Prior to March 1,
2006, most set-top receivers provided to new and existing DIRECTV U.S. subscribers were immediately
expensed upon activation as a subscriber acquisition or upgrade and retention cost in the Consolidated
Statements of Operations. Subsequent to the introduction of the lease program, we lease most set-top
receivers provided to new and existing subscribers, and therefore capitalize the set-top receivers in
‘‘Property and equipment, net’’ in the Consolidated Balance Sheets. We depreciate capitalized set-top
receivers over a three year estimated useful life and include the amount of set-top receivers capitalized
each period in ‘‘Cash paid for property and equipment’’ in the Consolidated Statements of Cash Flows.
The following table sets forth the amount of DIRECTV U.S. set-top receivers we capitalized, and
depreciation expense we recorded, under the lease program for each of the periods presented:
Years ended December 31,
Capitalized subscriber leased equipment: 2009 2008 2007
(Dollars in Millions)
Subscriber leased equipment—subscriber acquisitions ........... $ 564 $ 599 $ 762
Subscriber leased equipment—upgrade and retention ........... 419 537 774
Total subscriber leased equipment capitalized ................ $ 983 $1,136 $1,536
Depreciation expense—subscriber leased equipment ............ $1,333 $1,100 $ 645
Note 6: Goodwill and Intangible Assets
The following table sets forth the changes in the carrying amounts of ‘‘Goodwill’’ in the
Consolidated Balance Sheets by segment for the years ended December 31, 2009 and 2008:
Sports
Networks,
DIRECTV Eliminations
DIRECTV U.S. Latin America and Other Total
Balance as of January 1, 2008 ................. $3,032 $637 $ — $3,669
Acquisition related to home service provider
business ............................... 157 — — 157
Sky Brazil deferred income tax valuation allowance . — (73) — (73)
Balance as of December 31, 2008 .............. 3,189 564 — 3,753
Liberty Transaction ......................... — — 341 341
Sky Brazil foreign currency translation adjustment . . — 92 92
Purchase or acquisition accounting adjustments:
New acquisitions ......................... 24 — — 24
Finalization of prior acquisitions ............. (46) — — (46)
Balance as of December 31, 2009 .............. $3,167 $656 $341 $4,164
91