DIRECTV 2009 Annual Report Download - page 65
Download and view the complete annual report
Please find page 65 of the 2009 DIRECTV annual report below. You can navigate through the pages in the report by either clicking on the pages listed below, or by using the keyword search tool below to find specific information within the annual report.-
 1
1 -
2
-
3
-
4
-
5
-
6
-
7
-
8
-
9
-
10
-
11
-
12
-
13
-
14
-
15
-
16
-
17
-
18
-
19
-
20
-
21
-
22
-
23
-
24
-
25
-
26
-
27
-
28
-
29
-
30
-
31
-
32
-
33
-
34
-
35
-
36
-
37
-
38
-
39
-
40
-
41
-
42
-
43
-
44
-
45
-
46
-
47
-
48
-
49
-
50
-
51
-
52
-
53
-
54
-
 55
55 -
 56
56 -
 57
57 -
 58
58 -
 59
59 -
 60
60 -
 61
61 -
 62
62 -
 63
63 -
 64
64 -
 65
65 -
 66
66 -
 67
67 -
 68
68 -
 69
69 -
 70
70 -
 71
71 -
 72
72 -
 73
73 -
 74
74 -
 75
75 -
76
-
77
-
78
-
79
-
80
-
81
-
82
-
83
-
84
-
85
-
86
-
87
-
88
-
89
-
90
-
91
-
92
-
93
-
94
-
95
-
96
-
97
-
98
-
99
-
100
-
101
-
102
-
103
-
104
-
105
-
106
-
107
-
108
-
109
-
110
-
111
-
112
-
113
-
114
-
115
-
116
-
117
-
118
-
119
-
120
-
121
-
122
-
123
-
124
-
125
-
126
-
127
-
128
-
129
-
130
-
131
-
132
-
133
-
134
-
135
-
136
-
137
-
138
-
139
-
140
-
141
-
142
-
143
-
144
-
145
-
146
-
147
-
148
-
149
-
150
-
151
-
152
-
153
-
154
-
155
-
156
-
157
-
158
-
159
-
160
 |
 |

DIRECTV
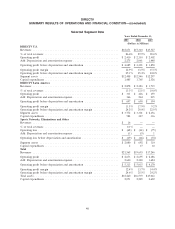
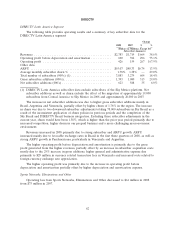
Operating profit before depreciation and amortization. The following table presents our operating
profit (loss) before depreciation and amortization by segment:
Change
Operating profit (loss) before depreciation and amortization by segment: 2009 2008 $ %
(Dollars in Millions)
DIRECTV U.S. ......................................... $4,685 $4,391 $294 6.7%
DIRECTV Latin America .................................. 697 690 7 1.0%
Sports Networks, Eliminations and Other ....................... (69) (66) (3) 4.5%
Total operating profit before depreciation and amortization .......... $5,313 $5,015 $298 5.9%
The increase in total operating profit before depreciation and amortization was due to higher gross
profit from the increase in revenues, partially offset by higher subscriber acquisition, upgrade and
retention and general and administrative costs at both DIRECTV U.S. and DIRECTV Latin America.
Operating profit. The following table presents our operating profit (loss) by segment:
Change
Operating profit (loss) by segment: 2009 2008 $ %
(Dollars in Millions)
DIRECTV U.S. ........................................ $2,410 $2,330 $ 80 3.4%
DIRECTV Latin America ................................. 331 426 (95) (22.3)%
Sports Networks, Eliminations and Other ...................... (68) (61) (7) 11.5%
Total operating profit .................................... $2,673 $2,695 $(22) (0.8)%
The decrease in our operating profit was primarily due to increased depreciation and amortization
from the DIRECTV U.S. and DIRECTV Latin America set-top receiver lease programs, more than
offsetting our increase in operating profit before depreciation and amortization.
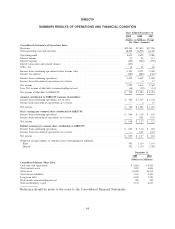
Interest income. The decrease in interest income to $41 million in 2009 from $81 million in 2008
was due to lower interest rates and lower average cash balances due mostly to the use of cash to fund
our share repurchase program.
Interest expense. The increase in interest expense to $423 million in 2009 from $360 million in
2008 was due to an increase in the average debt balance compared to 2008, partially offset by
decreased interest rates. We capitalized $18 million of interest costs in both 2008 and 2009.
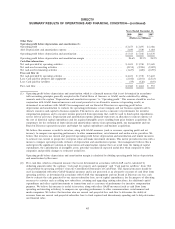
Liberty transaction and related charges. In 2009 we incurred $491 million in costs related to the
Liberty Transaction, which is comprised of a $337 premium paid to LEI shareholders, $111 million in
net losses for the partial settlement and fair-value adjustments related to the equity collars and
non-employee stock options and stock appreciation rights and $43 million of charges for transaction
related costs.
53