DIRECTV 2009 Annual Report Download - page 58
Download and view the complete annual report
Please find page 58 of the 2009 DIRECTV annual report below. You can navigate through the pages in the report by either clicking on the pages listed below, or by using the keyword search tool below to find specific information within the annual report.-
 1
1 -
2
-
3
-
4
-
5
-
6
-
7
-
8
-
9
-
10
-
11
-
12
-
13
-
14
-
15
-
16
-
17
-
18
-
19
-
20
-
21
-
22
-
23
-
24
-
25
-
26
-
27
-
28
-
29
-
30
-
31
-
32
-
33
-
34
-
35
-
36
-
37
-
38
-
39
-
40
-
41
-
42
-
43
-
44
-
45
-
46
-
47
-
 48
48 -
 49
49 -
 50
50 -
 51
51 -
 52
52 -
 53
53 -
 54
54 -
 55
55 -
 56
56 -
 57
57 -
 58
58 -
 59
59 -
 60
60 -
 61
61 -
 62
62 -
 63
63 -
 64
64 -
 65
65 -
 66
66 -
 67
67 -
 68
68 -
69
-
70
-
71
-
72
-
73
-
74
-
75
-
76
-
77
-
78
-
79
-
80
-
81
-
82
-
83
-
84
-
85
-
86
-
87
-
88
-
89
-
90
-
91
-
92
-
93
-
94
-
95
-
96
-
97
-
98
-
99
-
100
-
101
-
102
-
103
-
104
-
105
-
106
-
107
-
108
-
109
-
110
-
111
-
112
-
113
-
114
-
115
-
116
-
117
-
118
-
119
-
120
-
121
-
122
-
123
-
124
-
125
-
126
-
127
-
128
-
129
-
130
-
131
-
132
-
133
-
134
-
135
-
136
-
137
-
138
-
139
-
140
-
141
-
142
-
143
-
144
-
145
-
146
-
147
-
148
-
149
-
150
-
151
-
152
-
153
-
154
-
155
-
156
-
157
-
158
-
159
-
160
 |
 |

DIRECTV
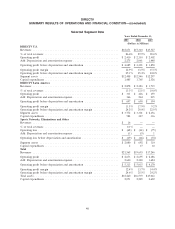
SUMMARY RESULTS OF OPERATIONS AND FINANCIAL CONDITION—(concluded)
Selected Segment Data
Years Ended December 31,
2009 2008 2007
(Dollars in Millions)
DIRECTV U.S.
Revenues ................................................... $18,671 $17,310 $15,527
% of total revenues ............................................ 86.6% 87.9% 90.0%
Operating profit .............................................. $2,410 $ 2,330 $ 2,402
Add: Depreciation and amortization expense ........................... 2,275 2,061 1,448
Operating profit before depreciation and amortization .................... $4,685 $ 4,391 $ 3,850
Operating profit margin ......................................... 12.9% 13.5% 15.5%
Operating profit before depreciation and amortization margin ............... 25.1% 25.4% 24.8%
Segment assets ............................................... $12,408 $12,546 $12,297
Capital expenditures ............................................ 1,485 1,765 2,326
DIRECTV Latin America
Revenues ................................................... $2,878 $ 2,383 $ 1,719
% of total revenues ............................................ 13.3% 12.1% 10.0%
Operating profit .............................................. $ 331 $ 426 $ 159
Add: Depreciation and amortization expense ........................... 366 264 235
Operating profit before depreciation and amortization .................... $ 697 $ 690 $ 394
Operating profit margin ......................................... 11.5% 17.9% 9.2%
Operating profit before depreciation and amortization margin ............... 24.2% 29.0% 22.9%
Segment assets ............................................... $3,772 $ 3,301 $ 2,456
Capital expenditures ............................................ 584 447 336
Sports Networks, Eliminations and Other
Revenues ................................................... $ 16 — —
% of total revenues ............................................ 0.1% — —
Operating loss ................................................ $ (68) $ (61) $ (75)
Add: Depreciation and amortization expense ........................... (1) (5) 1
Operating loss before depreciation and amortization ...................... $ (69) $ (66) $ (74)
Segment assets ............................................... $2,080 $ 692 $ 310
Capital expenditures ............................................ 2 17 30
Total
Revenues ................................................... $21,565 $19,693 $17,246
Operating profit .............................................. $2,673 $ 2,695 $ 2,486
Add: Depreciation and amortization expense ........................... 2,640 2,320 1,684
Operating profit before depreciation and amortization .................... $5,313 $ 5,015 $ 4,170
Operating profit margin ......................................... 12.4% 13.7% 14.4%
Operating profit before depreciation and amortization margin ............... 24.6% 25.5% 24.2%
Total assets .................................................. $18,260 $16,539 $15,063
Capital expenditures ............................................ 2,071 2,229 2,692
46