DIRECTV 2009 Annual Report Download - page 6
Download and view the complete annual report
Please find page 6 of the 2009 DIRECTV annual report below. You can navigate through the pages in the report by either clicking on the pages listed below, or by using the keyword search tool below to find specific information within the annual report.-
 1
1 -
 2
2 -
 3
3 -
 4
4 -
 5
5 -
 6
6 -
 7
7 -
 8
8 -
 9
9 -
 10
10 -
 11
11 -
 12
12 -
 13
13 -
 14
14 -
 15
15 -
 16
16 -
 17
17 -
18
-
19
-
20
-
21
-
22
-
23
-
24
-
25
-
26
-
27
-
28
-
29
-
30
-
31
-
32
-
33
-
34
-
35
-
36
-
37
-
38
-
39
-
40
-
41
-
42
-
43
-
44
-
45
-
46
-
47
-
48
-
49
-
50
-
51
-
52
-
53
-
54
-
55
-
56
-
57
-
58
-
59
-
60
-
61
-
62
-
63
-
64
-
65
-
66
-
67
-
68
-
69
-
70
-
71
-
72
-
73
-
74
-
75
-
76
-
77
-
78
-
79
-
80
-
81
-
82
-
83
-
84
-
85
-
86
-
87
-
88
-
89
-
90
-
91
-
92
-
93
-
94
-
95
-
96
-
97
-
98
-
99
-
100
-
101
-
102
-
103
-
104
-
105
-
106
-
107
-
108
-
109
-
110
-
111
-
112
-
113
-
114
-
115
-
116
-
117
-
118
-
119
-
120
-
121
-
122
-
123
-
124
-
125
-
126
-
127
-
128
-
129
-
130
-
131
-
132
-
133
-
134
-
135
-
136
-
137
-
138
-
139
-
140
-
141
-
142
-
143
-
144
-
145
-
146
-
147
-
148
-
149
-
150
-
151
-
152
-
153
-
154
-
155
-
156
-
157
-
158
-
159
-
160
 |
 |

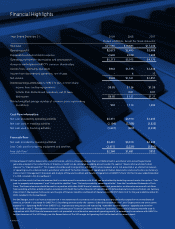
Financial Highlights
Years Ended December 31, 2009 2008 2007
(Dollars in Millions, Except Per Share Amounts)
Revenues $21,565 $19,693 $17,246
Operating profit $2,673 $2,695 $2,486
Depreciation and amortization expense 2,640 2,320 1,684
Operating profit before depreciation and amortization1$5,313 $5,015 $4,170
Amounts attributable to DIRECTV common shareholders:
Income from continuing operations $942 $1,515 $1,434
Income from discontinued operations, net of taxes – 6 17
Net income $942 $1,521 $1,451
Diluted earnings attributable to DIRECTV per common share:
Income from continuing operations $0.95 $1.36 $1.20
Income from discontinued operations, net of taxes – 0.01 0.01
Net income $0.95 $1.37 $1.21
Diluted weighted average number of common shares outstanding
(in millions) 992 1,114 1,202
Cash flow information
Net cash provided by operating activities $4,431 $3,910 $3,645
Net cash used in investing activities (2,194) (2,388) (2,822)
Net cash used in financing activities (1,637) (600) (2,239)
Free cash flow
Net cash provided by operating activities $4,431 $3,910 $3,645
Less: Cash paid for property, equipment and satellites (2,071) (2,229) (2,692)
Free cash flow2$2,360 $1,681 $953
(1) Operating profit before depreciation and amortization, which is a financial measure that is not determined in accordance with accounting principles
generally accepted in the United States of America, or GAAP, can be calculated by adding amounts under the caption “Depreciation and amortization
expense” to “Operating profit.” This measure should be used in conjunction with GAAP financial measures and is not presented as an alternative measure
of operating results, as determined in accordance with GAAP. For further discussion of operating profit before depreciation and amortization, see Summary
Data in Item 7, Management’s Discussion and Analysis of Financial Condition and Results of Operations in DIRECTV’s Form 10-K for the year ended December
31, 2009, included in this Annual Report.
(2) Free cash flow, which is a financial measure that is not determined in accordance with GAAP, can be calculated by deducting amounts under the captions “Cash
paid for property and equipment” and “Cash paid for satellites” from “Net cash provided by operating activities” from the Consolidated Statements of Cash
Flows. This financial measure should be used in conjunction with other GAAP financial measures and is not presented as an alternative measure of cash flows
from operating activities, as determined in accordance with GAAP. For further discussion of operating profit before depreciation and amortization, see Summary
Data in Item 7, Management’s Discussion and Analysis of Financial Condition and Results of Operations in DIRECTV’s Form 10-K for the year ended December 31,
2009, included in this Annual Report.
Pre-SAC Margin, which is a financial measure that is not determined in accordance with accounting principles generally accepted in the United States of
America, or GAAP, is calculated for DIRECTV U.S. by adding amounts under the captions “Subscriber acquisition costs” and “Depreciation and amortization
expense” to “Operating Profit” from DIRECTV U.S.’ segment operating results and subtracting “subscriber leased equipment - upgrade and retention”
as discussed in Item 7 – Management’s Discussion and Analysis of Financial Condition and Results of Operations. This financial measure should be used in
conjunction with GAAP financial measures and is not presented as an alternative measure of operating results, as determined in accordance with GAAP. For
further discussion of Pre-SAC Margin, see the Reconciliation of Pre-SAC margin to Operating Profit at the back of this annual report.
4 DIRECTV