DIRECTV 2009 Annual Report Download - page 155
Download and view the complete annual report
Please find page 155 of the 2009 DIRECTV annual report below. You can navigate through the pages in the report by either clicking on the pages listed below, or by using the keyword search tool below to find specific information within the annual report.-
 1
1 -
2
-
3
-
4
-
5
-
6
-
7
-
8
-
9
-
10
-
11
-
12
-
13
-
14
-
15
-
16
-
17
-
18
-
19
-
20
-
21
-
22
-
23
-
24
-
25
-
26
-
27
-
28
-
29
-
30
-
31
-
32
-
33
-
34
-
35
-
36
-
37
-
38
-
39
-
40
-
41
-
42
-
43
-
44
-
45
-
46
-
47
-
48
-
49
-
50
-
51
-
52
-
53
-
54
-
55
-
56
-
57
-
58
-
59
-
60
-
61
-
62
-
63
-
64
-
65
-
66
-
67
-
68
-
69
-
70
-
71
-
72
-
73
-
74
-
75
-
76
-
77
-
78
-
79
-
80
-
81
-
82
-
83
-
84
-
85
-
86
-
87
-
88
-
89
-
90
-
91
-
92
-
93
-
94
-
95
-
96
-
97
-
98
-
99
-
100
-
101
-
102
-
103
-
104
-
105
-
106
-
107
-
108
-
109
-
110
-
111
-
112
-
113
-
114
-
115
-
116
-
117
-
118
-
119
-
120
-
121
-
122
-
123
-
124
-
125
-
126
-
127
-
128
-
129
-
130
-
131
-
132
-
133
-
134
-
135
-
136
-
137
-
138
-
139
-
140
-
141
-
142
-
143
-
144
-
 145
145 -
 146
146 -
 147
147 -
 148
148 -
 149
149 -
 150
150 -
 151
151 -
 152
152 -
 153
153 -
 154
154 -
 155
155 -
 156
156 -
 157
157 -
 158
158 -
 159
159 -
 160
160
 |
 |
8APR201015210722
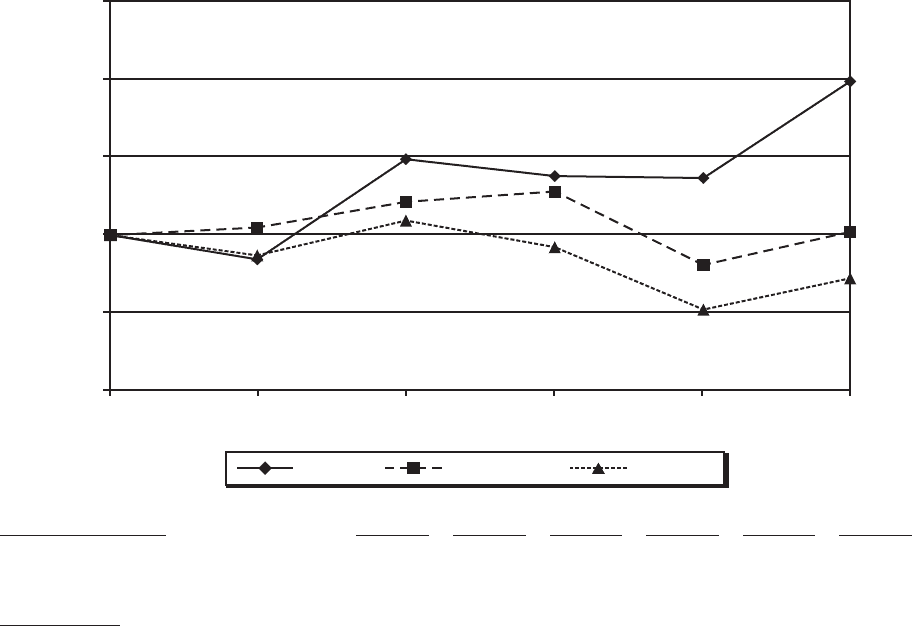
Comparative Performance
The following graph compares our five-year cumulative return to stockholders against: (a) the
Standard and Poor’s 500 Composite Stock Price Index, or the S&P 500 Index and (b) an industry peer
group.
The comparison assumes $100 investment in us, the S&P 500 Index and the industry peer group
on December 31, 2004, and reflects dividend reinvestment and annual weighting of the industry peer
indices by individual company market capitalization. Although the companies in the industry peer
indices were selected because of similar industry characteristics, they are not entirely representative of
our business.
We are providing an industry peer group comprised of the companies based on those that we have
identified for evaluation of executive compensation by the Compensation Committee of our Board of
Directors: British Sky Broadcasting Group, Cablevision Systems Corporation, CBS Corporation,
Comcast Corporation, Dish Network Corp, Walt Disney Company, Gannett Company, Liberty Global,
Inc, News Corporation, Qwest Communications International, Sirius XM Radio, Inc., Sprint Nextel
Corporation, Time Warner Cable Inc., Time Warner, Inc., and Viacom Inc. (1)
The following table sets forth our five-year cumulative return along with the S&P 500 Index and
the industry peer group.
Comparison of Cumulative Five Year Total Return
0
50
250
200
150
100
2004 200920082006 20072005
DOLLARS
DIRECTV Peer GroupS&P 500 Index
Company Name / Index 12/31/2004 12/31/2005 12/31/2006 12/31/2007 12/31/2008 12/31/2009
DIRECTV .................... 100 84.35 148.98 138.11 136.86 199.22
S&P 500 Index ................ 100 104.91 121.48 128.16 80.74 102.11
Peer Group ................... 100 86.89 109.41 92.24 51.94 72.13
(1) The peer group used by the Compensation Committee also includes Charter Communications, Inc.
and Liberty Media Corporation.