DIRECTV 2006 Annual Report Download - page 63
Download and view the complete annual report
Please find page 63 of the 2006 DIRECTV annual report below. You can navigate through the pages in the report by either clicking on the pages listed below, or by using the keyword search tool below to find specific information within the annual report.-
 1
1 -
2
-
3
-
4
-
5
-
6
-
7
-
8
-
9
-
10
-
11
-
12
-
13
-
14
-
15
-
16
-
17
-
18
-
19
-
20
-
21
-
22
-
23
-
24
-
25
-
26
-
27
-
28
-
29
-
30
-
31
-
32
-
33
-
34
-
35
-
36
-
37
-
38
-
39
-
40
-
41
-
42
-
43
-
44
-
45
-
46
-
47
-
48
-
49
-
50
-
51
-
52
-
 53
53 -
 54
54 -
 55
55 -
 56
56 -
 57
57 -
 58
58 -
 59
59 -
 60
60 -
 61
61 -
 62
62 -
 63
63 -
 64
64 -
 65
65 -
 66
66 -
 67
67 -
 68
68 -
 69
69 -
 70
70 -
 71
71 -
 72
72 -
 73
73 -
74
-
75
-
76
-
77
-
78
-
79
-
80
-
81
-
82
-
83
-
84
-
85
-
86
-
87
-
88
-
89
-
90
-
91
-
92
-
93
-
94
-
95
-
96
-
97
-
98
-
99
-
100
-
101
-
102
-
103
-
104
-
105
-
106
-
107
-
108
-
109
-
110
-
111
-
112
-
113
-
114
-
115
-
116
-
117
-
118
-
119
-
120
-
121
-
122
-
123
-
124
-
125
-
126
-
127
-
128
-
129
-
130
-
131
-
132
-
133
-
134
-
135
-
136
-
137
-
138
-
139
-
140
-
141
-
142
-
143
-
144
-
145
 |
 |

THE DIRECTV GROUP, INC.
and a higher interest rate on DIRECTV U.S.’ credit facility. Interest expense was net of capitalized
interest of $30.5 million in 2005 and $101.2 million in 2004.
Reorganization Income. Reorganization income of $43.0 million in 2004 includes a $62.6 million
gain that resulted from the settlement of certain obligations in connection with the confirmation of the
DLA LLC Reorganization Plan, partially offset by costs incurred to file the bankruptcy petition, legal
and consulting costs and other charges related to the DLA LLC reorganization. See Note 17 to the
Consolidated Financial Statements in Part II, Item 8 of this Annual Report for further information.
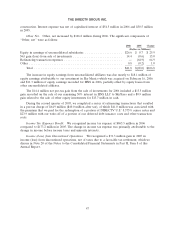
Other, Net. Other, net decreased by $462.6 million during 2005. The significant components of
‘‘Other, net’’ were as follows:
2005 2004 Change
(Dollars in Millions)
Net gain (loss) from sale of investments .......................... $ (0.6) $396.5 $(397.1)
Equity in earnings (losses) of unconsolidated subsidiaries .............. 0.7 (0.2) 0.9
Refinancing transaction expenses ................................ (64.9) — (64.9)
Other ................................................... (0.2) 1.3 (1.5)
Total ................................................. $(65.0) $397.6 $(462.6)
During 2004, we sold various equity investments for $510.5 million in cash, which resulted in us
recording a pre-tax gain of $396.5 million.
During the second quarter of 2005, DIRECTV U.S. completed a series of refinancing transactions
that resulted in a pre-tax charge of $64.9 million ($40.0 million after tax), of which $41.0 million was
associated with the premium that DIRECTV U.S. paid for the redemption of a portion of its 8.375%
senior notes and $23.9 million with our write-off of a portion of our deferred debt issuance costs and
other transaction costs.
Income Tax (Expense) Benefit. We recognized income tax expense of $173.2 million in 2005
compared to an income tax benefit of $690.6 million in 2004, which resulted from losses recorded in
2004. The increase in income tax expense was primarily attributable to higher income from continuing
operations before income taxes, minority interests and cumulative effect of accounting change. The
increase was partially offset by an income tax benefit recognized in 2005 due to the utilization of
capital loss carryforwards and a benefit associated with a reduction in the amount of accrued foreign
withholding taxes resulting from a favorable tax ruling in Mexico.
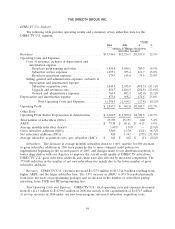
Income (Loss) from Discontinued Operations. Income (loss) from discontinued operations, net of
taxes, which includes the results of operations of discontinued businesses and the loss recorded for the
disposition of those operations, was as follows:
2005 2004 Change
(Dollars in Millions)
Income from discontinued operations, net of taxes .................... $ — $ 50.8 $(50.8)
Income (loss) on sale of discontinued operations, net of taxes ........... 31.3 (633.1) 664.4
Income (loss) from discontinued operations, net of taxes ............... $31.3 $(582.3) $613.6
The $31.3 million gain in income on sale of discontinued operations resulted from a favorable tax
settlement during the second quarter of 2005, which we discuss in Note 20 of the Notes to the
Consolidated Financial Statements in Part II, Item 8 of this Annual Report.
52