DIRECTV 2006 Annual Report Download - page 116
Download and view the complete annual report
Please find page 116 of the 2006 DIRECTV annual report below. You can navigate through the pages in the report by either clicking on the pages listed below, or by using the keyword search tool below to find specific information within the annual report.-
 1
1 -
2
-
3
-
4
-
5
-
6
-
7
-
8
-
9
-
10
-
11
-
12
-
13
-
14
-
15
-
16
-
17
-
18
-
19
-
20
-
21
-
22
-
23
-
24
-
25
-
26
-
27
-
28
-
29
-
30
-
31
-
32
-
33
-
34
-
35
-
36
-
37
-
38
-
39
-
40
-
41
-
42
-
43
-
44
-
45
-
46
-
47
-
48
-
49
-
50
-
51
-
52
-
53
-
54
-
55
-
56
-
57
-
58
-
59
-
60
-
61
-
62
-
63
-
64
-
65
-
66
-
67
-
68
-
69
-
70
-
71
-
72
-
73
-
74
-
75
-
76
-
77
-
78
-
79
-
80
-
81
-
82
-
83
-
84
-
85
-
86
-
87
-
88
-
89
-
90
-
91
-
92
-
93
-
94
-
95
-
96
-
97
-
98
-
99
-
100
-
101
-
102
-
103
-
104
-
105
-
 106
106 -
 107
107 -
 108
108 -
 109
109 -
 110
110 -
 111
111 -
 112
112 -
 113
113 -
 114
114 -
 115
115 -
 116
116 -
 117
117 -
 118
118 -
 119
119 -
 120
120 -
 121
121 -
 122
122 -
 123
123 -
 124
124 -
 125
125 -
 126
126 -
127
-
128
-
129
-
130
-
131
-
132
-
133
-
134
-
135
-
136
-
137
-
138
-
139
-
140
-
141
-
142
-
143
-
144
-
145
 |
 |

THE DIRECTV GROUP, INC.
NOTES TO THE CONSOLIDATED FINANCIAL STATEMENTS —(continued)
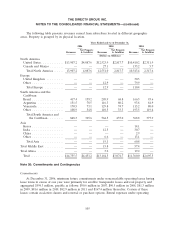
The following table presents revenues earned from subscribers located in different geographic
areas. Property is grouped by its physical location.
Years Ended and As of December 31,
2006 2005 2004
Net Property Net Property Net Property
Revenues & Satellites Revenues & Satellites Revenues & Satellites
(Dollars in Millions)
North America
United States ............. $13,907.2 $4,087.6 $12,523.9 $2,817.7 $10,410.2 $2,311.9
Canada and Mexico ........ — — 27.1 — 133.2 5.7
Total North America ...... 13,907.2 4,087.6 12,551.0 2,817.7 10,543.4 2,317.6
Europe
United Kingdom .......... — — — — 30.5 —
Other .................. — — 12.9 — 79.9 —
Total Europe ........... — — 12.9 — 110.4 —
South America and the
Caribbean
Brazil .................. 417.4 159.2 205.9 68.8 166.3 93.6
Argentina ............... 151.5 78.5 116.3 80.2 93.8 84.9
Venezuela ............... 170.5 73.1 129.8 74.7 115.2 80.0
Other .................. 108.9 54.8 110.5 33.3 193.5 119.4
Total South America and
the Caribbean ......... 848.3 365.6 562.5 257.0 568.8 377.9
Asia
Korea .................. — — — — 14.1 —
India ................... — — 12.5 — 30.7 —
China .................. — — — — 2.9 —
Other .................. — — 6.6 — 13.1 —
Total Asia ............. — — 19.1 — 60.8 —
Total Middle East ........... — — 15.8 — 57.4 —
Total Africa ............... — — 3.2 — 19.2 —
Total ................... $14,755.5 $4,453.2 $13,164.5 $3,074.7 $11,360.0 $2,695.5
Note 20: Commitments and Contingencies
Commitments
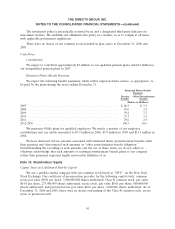
At December 31, 2006, minimum future commitments under noncancelable operating leases having
lease terms in excess of one year were primarily for satellite transponder leases and real property and
aggregated $594.3 million, payable as follows: $90.6 million in 2007, $90.5 million in 2008, $81.3 million
in 2009, $81.6 million in 2010, $82.9 million in 2011 and $167.4 million thereafter. Certain of these
leases contain escalation clauses and renewal or purchase options. Rental expenses under operating
105