DIRECTV 2006 Annual Report Download - page 50
Download and view the complete annual report
Please find page 50 of the 2006 DIRECTV annual report below. You can navigate through the pages in the report by either clicking on the pages listed below, or by using the keyword search tool below to find specific information within the annual report.-
 1
1 -
2
-
3
-
4
-
5
-
6
-
7
-
8
-
9
-
10
-
11
-
12
-
13
-
14
-
15
-
16
-
17
-
18
-
19
-
20
-
21
-
22
-
23
-
24
-
25
-
26
-
27
-
28
-
29
-
30
-
31
-
32
-
33
-
34
-
35
-
36
-
37
-
38
-
39
-
 40
40 -
 41
41 -
 42
42 -
 43
43 -
 44
44 -
 45
45 -
 46
46 -
 47
47 -
 48
48 -
 49
49 -
 50
50 -
 51
51 -
 52
52 -
 53
53 -
 54
54 -
 55
55 -
 56
56 -
 57
57 -
 58
58 -
 59
59 -
 60
60 -
61
-
62
-
63
-
64
-
65
-
66
-
67
-
68
-
69
-
70
-
71
-
72
-
73
-
74
-
75
-
76
-
77
-
78
-
79
-
80
-
81
-
82
-
83
-
84
-
85
-
86
-
87
-
88
-
89
-
90
-
91
-
92
-
93
-
94
-
95
-
96
-
97
-
98
-
99
-
100
-
101
-
102
-
103
-
104
-
105
-
106
-
107
-
108
-
109
-
110
-
111
-
112
-
113
-
114
-
115
-
116
-
117
-
118
-
119
-
120
-
121
-
122
-
123
-
124
-
125
-
126
-
127
-
128
-
129
-
130
-
131
-
132
-
133
-
134
-
135
-
136
-
137
-
138
-
139
-
140
-
141
-
142
-
143
-
144
-
145
 |
 |

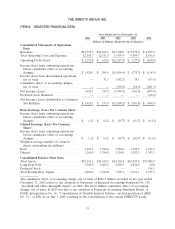
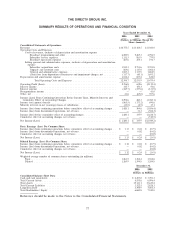
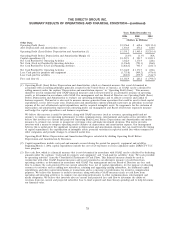
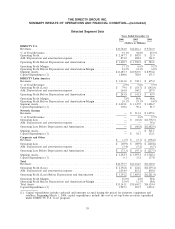
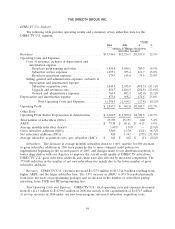
THE DIRECTV GROUP, INC.
SUMMARY RESULTS OF OPERATIONS AND FINANCIAL CONDITION—(concluded)
Selected Segment Data
Years Ended December 31,
2006 2005 2004
(Dollars in Millions)
DIRECTV U.S.
Revenues ................................................ $13,744.0 $12,216.1 $ 9,763.9
% of Total Revenues ........................................ 93.1% 92.8% 85.9%
Operating Profit ........................................... $2,347.7 $ 802.0 $ 21.9
Add: Depreciation and amortization expense ........................ 873.0 698.2 561.2
Operating Profit Before Depreciation and Amortization ................ $3,220.7 $ 1,500.2 $ 583.1
Operating Profit Margin ...................................... 17.1% 6.6% 0.2%
Operating Profit Before Depreciation and Amortization-Margin ........... 23.4% 12.3% 6.0%
Segment Assets ............................................ $11,687.3 $10,525.0 $ 8,994.2
Capital Expenditures (1) ..................................... 1,808.6 782.0 671.5
DIRECTV Latin America
Revenues ................................................ $1,013.0 $ 742.1 $ 675.2
% of Total Revenues ........................................ 6.9% 5.6% 5.9%
Operating Profit (Loss) ...................................... $ 79.0 $ (18.7) $ (142.0)
Add: Depreciation and amortization expense ........................ 164.8 160.2 187.9
Operating Profit Before Depreciation and Amortization ................ $ 243.8 $ 141.5 $ 45.9
Operating Profit Margin ...................................... 7.8% N/A N/A
Operating Profit Before Depreciation and Amortization-Margin ........... 24.1% 19.1% 6.8%
Segment Assets ............................................ $2,001.1 $ 1,147.9 $ 1,086.7
Capital Expenditures (1) ..................................... 178.6 90.4 81.7
Network Systems
Revenues ................................................ — $ 211.4 $ 1,099.1
% of Total Revenues ........................................ — 1.6% 9.7%
Operating Loss ............................................ — $ (60.8) $(1,778.5)
Add: Depreciation and amortization expense ........................ — — 95.6
Operating Loss Before Depreciation and Amortization ................. — $ (60.8) $(1,682.9)
Segment Assets ............................................ — — $ 521.1
Capital Expenditures (1) ..................................... — $ 18.1 132.1
Corporate and Other
Revenues ................................................ $ (1.5) $ (5.1) $ (178.2)
Operating Loss ............................................ $ (69.9) $ (89.9) $ (220.8)
Add: Depreciation and amortization expense ........................ (3.4) (5.2) (6.7)
Operating Loss Before Depreciation and Amortization ................. $ (73.3) $ (95.1) $ (227.5)
Segment Assets ............................................ $1,452.7 $ 3,957.3 $ 3,722.4
Capital Expenditures (1) ..................................... 0.1 33.2 137.8
Total
Revenues ................................................ $14,755.5 $13,164.5 $11,360.0
Operating Profit (Loss) ...................................... $2,356.8 $ 632.6 $(2,119.4)
Add: Depreciation and amortization expense ........................ 1,034.4 853.2 838.0
Operating Profit (Loss) Before Depreciation and Amortization ........... $3,391.2 $ 1,485.8 $(1,281.4)
Operating Profit Margin ...................................... 16.0% 4.8% N/A
Operating Profit Before Depreciation and Amortization-Margin ........... 23.0% 11.3% N/A
Total Assets .............................................. $15,141.1 $15,630.2 $14,324.4
Capital Expenditures (1) ..................................... 1,987.3 923.7 1,023.1
(1) Capital expenditures include cash paid and amounts accrued during the period for property, equipment and
satellites. Beginning March 1, 2006, capital expenditures include the cost of set-top boxes receivers capitalized
under DIRECTV U.S.’ lease program.
39