DIRECTV 2006 Annual Report Download - page 110
Download and view the complete annual report
Please find page 110 of the 2006 DIRECTV annual report below. You can navigate through the pages in the report by either clicking on the pages listed below, or by using the keyword search tool below to find specific information within the annual report.-
 1
1 -
2
-
3
-
4
-
5
-
6
-
7
-
8
-
9
-
10
-
11
-
12
-
13
-
14
-
15
-
16
-
17
-
18
-
19
-
20
-
21
-
22
-
23
-
24
-
25
-
26
-
27
-
28
-
29
-
30
-
31
-
32
-
33
-
34
-
35
-
36
-
37
-
38
-
39
-
40
-
41
-
42
-
43
-
44
-
45
-
46
-
47
-
48
-
49
-
50
-
51
-
52
-
53
-
54
-
55
-
56
-
57
-
58
-
59
-
60
-
61
-
62
-
63
-
64
-
65
-
66
-
67
-
68
-
69
-
70
-
71
-
72
-
73
-
74
-
75
-
76
-
77
-
78
-
79
-
80
-
81
-
82
-
83
-
84
-
85
-
86
-
87
-
88
-
89
-
90
-
91
-
92
-
93
-
94
-
95
-
96
-
97
-
98
-
99
-
 100
100 -
 101
101 -
 102
102 -
 103
103 -
 104
104 -
 105
105 -
 106
106 -
 107
107 -
 108
108 -
 109
109 -
 110
110 -
 111
111 -
 112
112 -
 113
113 -
 114
114 -
 115
115 -
 116
116 -
 117
117 -
 118
118 -
 119
119 -
 120
120 -
121
-
122
-
123
-
124
-
125
-
126
-
127
-
128
-
129
-
130
-
131
-
132
-
133
-
134
-
135
-
136
-
137
-
138
-
139
-
140
-
141
-
142
-
143
-
144
-
145
 |
 |

THE DIRECTV GROUP, INC.
NOTES TO THE CONSOLIDATED FINANCIAL STATEMENTS —(continued)
Changes in the status of outstanding restricted stock units were as follows:
Weighted-Average
Grant-Date
Stock Units Fair Value
Nonvested at January 1, 2006 ................................. 7,582,933 $16.03
Granted ................................................ 3,082,425 13.57
Vested and Distributed ..................................... (1,273,311) 10.66
Forfeited ................................................ (751,893) 16.64
Nonvested at December 31, 2006 .............................. 8,640,154 15.89
The weighted average grant-date fair value of restricted stock units granted during the year ended
December 31, 2005 was $16.61. The weighted average grant-date fair value of restricted stock units
granted during the year ended December 31, 2004 was $17.46.
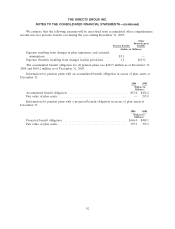
As of December 31, 2006, there was $42.2 million of unrecognized compensation expense related
to unvested restricted stock units that we expect to recognize as follows: $30.1 million in 2007 and
$12.1 million in 2008. The total fair value of restricted stock units vested and distributed during the
year ended December 31, 2006 was $20.7 million. The total fair value of restricted stock units vested
and distributed during the year ended December 31, 2005 was $25.9 million. There were no restricted
stock units vested and distributed during the year ended December 31, 2004.
Stock Options
The Compensation Committee has also granted stock options to acquire our common stock under
our stock plans to certain of our employees and executives. The exercise price of options granted is
equal to at least 100% of the fair market value of the common stock on the date the options were
granted. These nonqualified options generally vested over one to five years, expire ten years from date
of grant and are subject to earlier termination under certain conditions.
Changes in the status of outstanding options were as follows:
Shares Under Weighted-Average
Option Exercise Price
Outstanding and exercisable at January 1, 2006 ................... 78,714,506 $24.52
Granted ............................................... — —
Exercised .............................................. (18,808,828) 13.63
Forfeited or expired ....................................... (3,979,240) 32.84
Outstanding and exercisable at December 31, 2006 ................ 55,926,438 27.59
As of December 31, 2006, our outstanding stock options have an aggregate intrinsic value (market
value less exercise price) of $133.0 million and a weighted average remaining contractual life of
approximately 3.7 years. The total intrinsic value of options exercised was $115.0 million during the
year ended December 31, 2006, $18.2 million during the year ended December 31, 2005 and
$12.8 million during the year ended December 31, 2004, based on the intrinsic value of individual
awards on the date of exercise.
99