DIRECTV 2006 Annual Report Download - page 131
Download and view the complete annual report
Please find page 131 of the 2006 DIRECTV annual report below. You can navigate through the pages in the report by either clicking on the pages listed below, or by using the keyword search tool below to find specific information within the annual report.-
 1
1 -
2
-
3
-
4
-
5
-
6
-
7
-
8
-
9
-
10
-
11
-
12
-
13
-
14
-
15
-
16
-
17
-
18
-
19
-
20
-
21
-
22
-
23
-
24
-
25
-
26
-
27
-
28
-
29
-
30
-
31
-
32
-
33
-
34
-
35
-
36
-
37
-
38
-
39
-
40
-
41
-
42
-
43
-
44
-
45
-
46
-
47
-
48
-
49
-
50
-
51
-
52
-
53
-
54
-
55
-
56
-
57
-
58
-
59
-
60
-
61
-
62
-
63
-
64
-
65
-
66
-
67
-
68
-
69
-
70
-
71
-
72
-
73
-
74
-
75
-
76
-
77
-
78
-
79
-
80
-
81
-
82
-
83
-
84
-
85
-
86
-
87
-
88
-
89
-
90
-
91
-
92
-
93
-
94
-
95
-
96
-
97
-
98
-
99
-
100
-
101
-
102
-
103
-
104
-
105
-
106
-
107
-
108
-
109
-
110
-
111
-
112
-
113
-
114
-
115
-
116
-
117
-
118
-
119
-
120
-
 121
121 -
 122
122 -
 123
123 -
 124
124 -
 125
125 -
 126
126 -
 127
127 -
 128
128 -
 129
129 -
 130
130 -
 131
131 -
 132
132 -
 133
133 -
 134
134 -
 135
135 -
 136
136 -
 137
137 -
 138
138 -
 139
139 -
 140
140 -
 141
141 -
142
-
143
-
144
-
145
 |
 |

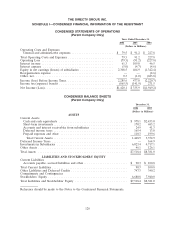
THE DIRECTV GROUP, INC.
SCHEDULE I—CONDENSED FINANCIAL INFORMATION OF THE REGISTRANT
CONDENSED STATEMENTS OF OPERATIONS
(Parent Company Only)
Years Ended December 31,
2006 2005 2004
(Dollars in Millions)
Operating Costs and Expenses
General and administrative expenses ........................ $ 79.5 $ 91.2 $ 227.8
Total Operating Costs and Expenses .......................... 79.5 91.2 227.8
Operating Loss ......................................... (79.5) (91.2) (227.8)
Interest income ......................................... 61.3 109.8 46.5
Interest expense ........................................ (5.0) (4.7) (4.6)
Equity in net earnings (losses) of subsidiaries ................... 2,308.5 464.9 (1,342.4)
Reorganization expense ................................... — — (8.6)
Other, net ............................................. 0.3 (1.0) (683.8)
Income (loss) Before Income Taxes ........................... 2,285.6 477.8 (2,220.7)
Income tax (expense) benefit ............................... (865.5) (141.9) 271.5
Net Income (Loss) ....................................... $1,420.1 $ 335.9 $(1,949.2)
CONDENSED BALANCE SHEETS
(Parent Company Only)
December 31,
2006 2005
(Dollars in Millions)
ASSETS
Current Assets
Cash and cash equivalents ....................................... $ 978.1 $2,435.0
Short-term investments .......................................... 170.2 683.2
Accounts and interest receivables from subsidiaries ..................... 24.9 41.3
Deferred income taxes .......................................... 165.4 13.8
Prepaid expenses and other ...................................... 110.3 199.6
Total Current Assets .......................................... 1,448.9 3,372.9
Deferred Income Taxes ........................................... — 164.9
Investments in Subsidiaries ........................................ 6,023.4 4,717.1
Other Assets ................................................... 46.1 126.1
Total Assets ................................................... $7,518.4 $8,381.0
LIABILITIES AND STOCKHOLDERS’ EQUITY
Current Liabilities
Accounts payable, accrued liabilities and other ......................... $ 90.3 $ 100.8
Total Current Liabilities ........................................... 90.3 100.8
Other Liabilities and Deferred Credits ................................ 747.3 340.2
Commitments and Contingencies
Stockholders’ Equity ............................................. 6,680.8 7,940.0
Total Liabilities and Stockholders’ Equity .............................. $7,518.4 $8,381.0
Reference should be made to the Notes to the Condensed Financial Statements.
120