DIRECTV 2006 Annual Report Download - page 48
Download and view the complete annual report
Please find page 48 of the 2006 DIRECTV annual report below. You can navigate through the pages in the report by either clicking on the pages listed below, or by using the keyword search tool below to find specific information within the annual report.-
 1
1 -
2
-
3
-
4
-
5
-
6
-
7
-
8
-
9
-
10
-
11
-
12
-
13
-
14
-
15
-
16
-
17
-
18
-
19
-
20
-
21
-
22
-
23
-
24
-
25
-
26
-
27
-
28
-
29
-
30
-
31
-
32
-
33
-
34
-
35
-
36
-
37
-
 38
38 -
 39
39 -
 40
40 -
 41
41 -
 42
42 -
 43
43 -
 44
44 -
 45
45 -
 46
46 -
 47
47 -
 48
48 -
 49
49 -
 50
50 -
 51
51 -
 52
52 -
 53
53 -
 54
54 -
 55
55 -
 56
56 -
 57
57 -
 58
58 -
59
-
60
-
61
-
62
-
63
-
64
-
65
-
66
-
67
-
68
-
69
-
70
-
71
-
72
-
73
-
74
-
75
-
76
-
77
-
78
-
79
-
80
-
81
-
82
-
83
-
84
-
85
-
86
-
87
-
88
-
89
-
90
-
91
-
92
-
93
-
94
-
95
-
96
-
97
-
98
-
99
-
100
-
101
-
102
-
103
-
104
-
105
-
106
-
107
-
108
-
109
-
110
-
111
-
112
-
113
-
114
-
115
-
116
-
117
-
118
-
119
-
120
-
121
-
122
-
123
-
124
-
125
-
126
-
127
-
128
-
129
-
130
-
131
-
132
-
133
-
134
-
135
-
136
-
137
-
138
-
139
-
140
-
141
-
142
-
143
-
144
-
145
 |
 |

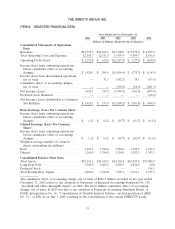
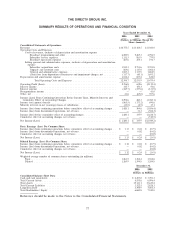
THE DIRECTV GROUP, INC.
SUMMARY RESULTS OF OPERATIONS AND FINANCIAL CONDITION
Years Ended December 31,
2006 2005 2004
(Dollars in Millions, Except Per
Share Amounts)
Consolidated Statements of Operations:
Revenues ..................................................... $14,755.5 $13,164.5 $11,360.0
Operating Costs and Expenses
Costs of revenues, exclusive of depreciation and amortization expense
Broadcast programming and other ............................... 6,200.9 5,485.3 4,996.5
Subscriber service expenses .................................... 1,111.3 981.9 779.9
Broadcast operations expenses .................................. 285.6 254.1 196.7
Selling, general and administrative expenses, exclusive of depreciation and amortization
expense
Subscriber acquisitions costs ................................... 1,945.3 2,751.6 2,703.8
Upgrade and retention costs ................................... 869.6 1,117.0 1,002.4
General and administrative expenses .............................. 1,069.3 1,133.9 1,268.9
(Gain) loss from disposition of businesses and impairment charges, net ........ (117.7) (45.1) 1,693.2
Depreciation and amortization expense .................................. 1,034.4 853.2 838.0
Total Operating Costs and Expenses ........................... 12,398.7 12,531.9 13,479.4
Operating Profit (Loss) ............................................ 2,356.8 632.6 (2,119.4)
Interest income ................................................. 145.7 150.3 50.6
Interest expense ................................................ (245.7) (237.6) (131.9)
Reorganization income ............................................ — — 43.0
Other, net .................................................... 41.8 (65.0) 397.6
Income (Loss) From Continuing Operations Before Income Taxes, Minority Interests and
Cumulative Effect of Accounting Changes ............................... 2,298.6 480.3 (1,760.1)
Income tax (expense) benefit ........................................ (865.5) (173.2) 690.6
Minority interests in net (earnings) losses of subsidiaries ....................... (13.0) (2.5) 13.1
Income (loss) from continuing operations before cumulative effect of accounting changes . . 1,420.1 304.6 (1,056.4)
Income (loss) from discontinued operations, net of taxes ....................... — 31.3 (582.3)
Income (loss) before cumulative effect of accounting changes .................... 1,420.1 335.9 (1,638.7)
Cumulative effect of accounting changes, net of taxes ......................... — — (310.5)
Net Income (Loss) ............................................... $1,420.1 $ 335.9 $ (1,949.2)
Basic Earnings (Loss) Per Common Share:
Income (loss) from continuing operations before cumulative effect of accounting changes . . $ 1.13 $ 0.22 $ (0.77)
Income (loss) from discontinued operations, net of taxes ....................... — 0.02 (0.42)
Cumulative effect of accounting changes, net of taxes ......................... — — (0.22)
Net Income (Loss) ............................................... $ 1.13 $ 0.24 $ (1.41)
Diluted Earnings (Loss) Per Common Share:
Income (loss) from continuing operations before cumulative effect of accounting changes . . $ 1.12 $ 0.22 $ (0.77)
Income (loss) from discontinued operations, net of taxes ....................... — 0.02 (0.42)
Cumulative effect of accounting changes, net of taxes ......................... — — (0.22)
Net Income (Loss) ............................................... $ 1.12 $ 0.24 $ (1.41)
Weighted average number of common shares outstanding (in millions)
Basic ..................................................... 1,261.5 1,388.4 1,384.8
Diluted ................................................... 1,269.9 1,394.8 1,384.8
December 31,
2006 2005
(Dollars in Millions)
Consolidated Balance Sheet Data:
Cash and cash equivalents .................................................. $2,499.0 $ 3,701.3
Total Current Assets ...................................................... 4,555.6 6,096.4
Total Assets ........................................................... 15,141.1 15,630.2
Total Current Liabilities ................................................... 3,322.5 2,828.1
Long-Term Debt ........................................................ 3,394.9 3,405.3
Total Stockholders’ Equity .................................................. 6,680.8 7,940.0
Reference should be made to the Notes to the Consolidated Financial Statements.
37