DIRECTV 2006 Annual Report Download - page 57
Download and view the complete annual report
Please find page 57 of the 2006 DIRECTV annual report below. You can navigate through the pages in the report by either clicking on the pages listed below, or by using the keyword search tool below to find specific information within the annual report.-
 1
1 -
2
-
3
-
4
-
5
-
6
-
7
-
8
-
9
-
10
-
11
-
12
-
13
-
14
-
15
-
16
-
17
-
18
-
19
-
20
-
21
-
22
-
23
-
24
-
25
-
26
-
27
-
28
-
29
-
30
-
31
-
32
-
33
-
34
-
35
-
36
-
37
-
38
-
39
-
40
-
41
-
42
-
43
-
44
-
45
-
46
-
 47
47 -
 48
48 -
 49
49 -
 50
50 -
 51
51 -
 52
52 -
 53
53 -
 54
54 -
 55
55 -
 56
56 -
 57
57 -
 58
58 -
 59
59 -
 60
60 -
 61
61 -
 62
62 -
 63
63 -
 64
64 -
 65
65 -
 66
66 -
 67
67 -
68
-
69
-
70
-
71
-
72
-
73
-
74
-
75
-
76
-
77
-
78
-
79
-
80
-
81
-
82
-
83
-
84
-
85
-
86
-
87
-
88
-
89
-
90
-
91
-
92
-
93
-
94
-
95
-
96
-
97
-
98
-
99
-
100
-
101
-
102
-
103
-
104
-
105
-
106
-
107
-
108
-
109
-
110
-
111
-
112
-
113
-
114
-
115
-
116
-
117
-
118
-
119
-
120
-
121
-
122
-
123
-
124
-
125
-
126
-
127
-
128
-
129
-
130
-
131
-
132
-
133
-
134
-
135
-
136
-
137
-
138
-
139
-
140
-
141
-
142
-
143
-
144
-
145
 |
 |

THE DIRECTV GROUP, INC.
RESULTS OF OPERATIONS
Year Ended December 31, 2006 Compared with the Year Ended December 31, 2005
Consolidated Results of Operations
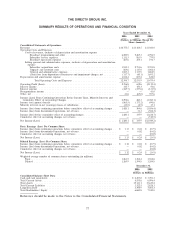
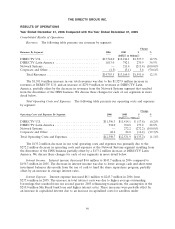
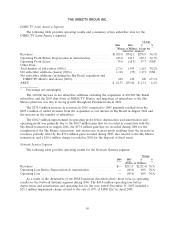
Revenues. The following table presents our revenues by segment:
Change
Revenues By Segment: 2006 2005 $ %
(Dollars in Millions)
DIRECTV U.S. ................................ $13,744.0 $12,216.1 $1,527.9 12.5%
DIRECTV Latin America ......................... 1,013.0 742.1 270.9 36.5%
Network Systems ................................ — 211.4 (211.4) (100.0)%
Corporate and Other ............................. (1.5) (5.1) 3.6 (70.6)%
Total Revenues .............................. $14,755.5 $13,164.5 $1,591.0 12.1%
The $1,591.0 million increase in our total revenues was due to the $1,527.9 million increase in
revenues at DIRECTV U.S. and an increase of $270.9 million in revenues at DIRECTV Latin
America, partially offset by the decrease in revenues from the Network Systems segment that resulted
from the divestiture of the HNS business. We discuss these changes for each of our segments in more
detail below.
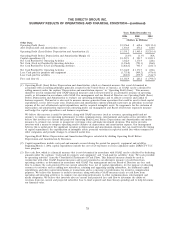
Total Operating Costs and Expenses. The following table presents our operating costs and expenses
by segment:
Change
Operating Costs and Expenses By Segment: 2006 2005 $ %
(Dollars in Millions)
DIRECTV U.S. ................................. $11,396.3 $11,414.1 $ (17.8) (0.2)%
DIRECTV Latin America .......................... 934.0 760.8 173.2 22.8%
Network Systems ................................ — 272.2 (272.2) (100.0)%
Corporate and Other ............................. 68.4 84.8 (16.4) (19.3)%
Total Operating Costs and Expenses .................. $12,398.7 $12,531.9 $(133.2) (1.1)%
The $133.2 million decrease in our total operating costs and expenses was primarily due to the
$272.2 million decrease in operating costs and expenses at the Network Systems segment resulting from
the divestiture of the HNS business partially offset by a $173.2 million increase at DIRECTV Latin
America. We discuss these changes for each of our segments in more detail below.
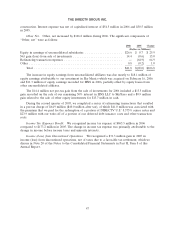
Interest Income. Interest income decreased $4.6 million to $145.7 million in 2006 compared to
$150.3 million in 2005. The decrease in interest income was due to lower average cash and short-term
investment balances due mostly from the use of cash to fund the share repurchase program, partially
offset by an increase in average interest rates.
Interest Expense. Interest expense increased $8.1 million to $245.7 million in 2006 from
$237.6 million in 2005. The increase in total interest costs was due to higher average outstanding
borrowings that resulted from our second quarter 2005 refinancing transactions, the assumption of the
$210.0 million Sky Brazil bank loan and higher interest rates. These increases were partially offset by
an increase in capitalized interest due to an increase in capitalized costs for satellites under
46