DIRECTV 2006 Annual Report Download - page 108
Download and view the complete annual report
Please find page 108 of the 2006 DIRECTV annual report below. You can navigate through the pages in the report by either clicking on the pages listed below, or by using the keyword search tool below to find specific information within the annual report.-
 1
1 -
2
-
3
-
4
-
5
-
6
-
7
-
8
-
9
-
10
-
11
-
12
-
13
-
14
-
15
-
16
-
17
-
18
-
19
-
20
-
21
-
22
-
23
-
24
-
25
-
26
-
27
-
28
-
29
-
30
-
31
-
32
-
33
-
34
-
35
-
36
-
37
-
38
-
39
-
40
-
41
-
42
-
43
-
44
-
45
-
46
-
47
-
48
-
49
-
50
-
51
-
52
-
53
-
54
-
55
-
56
-
57
-
58
-
59
-
60
-
61
-
62
-
63
-
64
-
65
-
66
-
67
-
68
-
69
-
70
-
71
-
72
-
73
-
74
-
75
-
76
-
77
-
78
-
79
-
80
-
81
-
82
-
83
-
84
-
85
-
86
-
87
-
88
-
89
-
90
-
91
-
92
-
93
-
94
-
95
-
96
-
97
-
 98
98 -
 99
99 -
 100
100 -
 101
101 -
 102
102 -
 103
103 -
 104
104 -
 105
105 -
 106
106 -
 107
107 -
 108
108 -
 109
109 -
 110
110 -
 111
111 -
 112
112 -
 113
113 -
 114
114 -
 115
115 -
 116
116 -
 117
117 -
 118
118 -
119
-
120
-
121
-
122
-
123
-
124
-
125
-
126
-
127
-
128
-
129
-
130
-
131
-
132
-
133
-
134
-
135
-
136
-
137
-
138
-
139
-
140
-
141
-
142
-
143
-
144
-
145
 |
 |

THE DIRECTV GROUP, INC.
NOTES TO THE CONSOLIDATED FINANCIAL STATEMENTS —(continued)
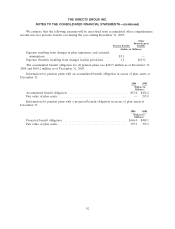
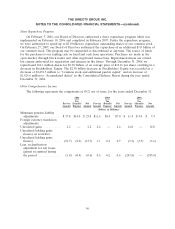
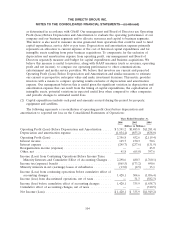
Accumulated Other Comprehensive Loss
The following represent the components of accumulated other comprehensive income as of
December 31:
2006 2005
(Dollars in
Millions)
Unamortized net amount resulting from changes in defined benefit plan experience
and actuarial assumptions, net of taxes ................................. $(52.9) $ —
Unamortized amount resulting from changes in defined benefit plan provisions, net of
taxes .......................................................... (4.1) —
Minimum pension liability adjustment, net of taxes .......................... — (34.4)
Accumulated unrealized gains on securities, net of taxes ...................... 8.8 23.1
Accumulated foreign currency translation adjustments ........................ (0.5) (2.7)
Total Accumulated Other Comprehensive Loss .......................... $(48.7) $(14.0)
We recorded a $46.4 million charge to ‘‘Accumulated Other Comprehensive Loss’’ in our
Consolidated Balance Sheets as of December 31, 2006 for the initial adoption of SFAS No. 158. See
Note 2 for additional information regarding our adoption of SFAS No. 158.
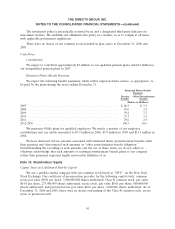
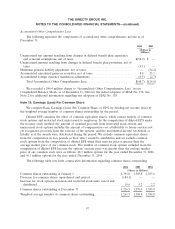
Note 13: Earnings (Loss) Per Common Share
We compute Basic Earnings (Loss) Per Common Share, or EPS, by dividing net income (loss) by
the weighted average number of common shares outstanding for the period.
Diluted EPS considers the effect of common equivalent shares, which consist entirely of common
stock options and restricted stock units issued to employees. In the computation of diluted EPS under
the treasury stock method, the amount of assumed proceeds from nonvested stock awards and
unexercised stock options includes the amount of compensation cost attributable to future services not
yet recognized, proceeds from the exercise of the options, and the incremental income tax benefit or
liability as if the awards were distributed during the period. We exclude common equivalent shares
from the computation in loss periods as their effect would be antidilutive and we exclude common
stock options from the computation of diluted EPS when their exercise price is greater than the
average market price of our common stock. The number of common stock options excluded from the
computation of diluted EPS because the options’ exercise price was greater than the average market
price of our common stock were as follows: 48.3 million options for the year ended December 31, 2006,
and 66.1 million options for the year ended December 31, 2005.
The following table sets forth comparative information regarding common shares outstanding:
2006 2005 2004
(Shares in Millions)
Common shares outstanding at January 1 ......................... 1,391.0 1,385.8 1,383.6
Decrease for common shares repurchased and retired ................ (184.1) — —
Increase for stock options exercised and restricted stock units vested and
distributed ............................................. 19.6 5.2 2.2
Common shares outstanding at December 31 ...................... 1,226.5 1,391.0 1,385.8
Weighted average number of common shares outstanding ............. 1,261.5 1,388.4 1,384.8
97