CarMax 2009 Annual Report Download - page 74
Download and view the complete annual report
Please find page 74 of the 2009 CarMax annual report below. You can navigate through the pages in the report by either clicking on the pages listed below, or by using the keyword search tool below to find specific information within the annual report.-
 1
1 -
2
-
3
-
4
-
5
-
6
-
7
-
8
-
9
-
10
-
11
-
12
-
13
-
14
-
15
-
16
-
17
-
18
-
19
-
20
-
21
-
22
-
23
-
24
-
25
-
26
-
27
-
28
-
29
-
30
-
31
-
32
-
33
-
34
-
35
-
36
-
37
-
38
-
39
-
40
-
41
-
42
-
43
-
44
-
45
-
46
-
47
-
48
-
49
-
50
-
51
-
52
-
53
-
54
-
55
-
56
-
57
-
58
-
59
-
60
-
61
-
62
-
63
-
 64
64 -
 65
65 -
 66
66 -
 67
67 -
 68
68 -
 69
69 -
 70
70 -
 71
71 -
 72
72 -
 73
73 -
 74
74 -
 75
75 -
 76
76 -
 77
77 -
 78
78 -
 79
79 -
 80
80 -
 81
81 -
 82
82 -
 83
83 -
 84
84 -
85
-
86
-
87
-
88
 |
 |

68
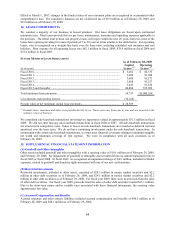
19. SELECTED QUARTERLY FINANCIAL DATA (UNAUDITED)
First Quarter Second Quarter Third Quarter Fourth Quarter Fiscal Year
(In thousands except
p
er share data) 2009 2009 2009 2009 2009
Net sales and operating
revenues................................. $ 2,208,763 $ 1,839,054 $ 1,455,632 $ 1,470,517 $ 6,973,966
Gross profit ................................ $ 282,714 $ 255,913 $ 199,236 $ 230,307 $ 968,170
CarMax Auto Finance
income (loss).......................... $ 9,819 $ (7,141) $ (15,360) $ 27,968 $ 15,286
Selling, general and
administrative expenses ........ $ 242,984 $ 225,148 $ 217,482 $ 196,744 $ 882,358
Net earnings (loss) ..................... $ 29,558 $ 14,006 $ (21,874) $ 37,523 $ 59,213
Net earnings (loss) per share:
Basic ...................................... $ 0.14 $ 0.06 $ (0.10) $ 0.17 $ 0.27
Diluted ................................... $ 0.13 $ 0.06 $ (0.10) $ 0.17 $ 0.27
First Quarter Second Quarter Third Quarter Fourth Quarter Fiscal Year
(In thousands except
p
er share data) 2008 2008 2008 2008 2008
Net sales and operating
revenues................................... $ 2,147,134 $ 2,122,530 $ 1,885,300 $ 2,044,607 $ 8,199,571
Gross profit ................................ $ 284,221 $ 288,194 $ 242,883 $ 257,127 $ 1,072,425
CarMax Auto Finance
income (loss).......................... $ 37,068 $ 33,412 $ 16,347 $ (962) $ 85,865
Selling, general and
administrative expenses ........ $ 213,814 $ 214,196 $ 210,508 $ 219,854 $ 858,372
Net earnings ............................... $ 65,355 $ 64,995 $ 29,846 $ 21,829 $ 182,025
Net earnings per share:
Basic ...................................... $ 0.30 $ 0.30 $ 0.14 $ 0.10 $ 0.84
Diluted ................................... $ 0.30 $ 0.29 $ 0.14 $ 0.10 $ 0.83