CarMax 2009 Annual Report Download - page 61
Download and view the complete annual report
Please find page 61 of the 2009 CarMax annual report below. You can navigate through the pages in the report by either clicking on the pages listed below, or by using the keyword search tool below to find specific information within the annual report.-
 1
1 -
2
-
3
-
4
-
5
-
6
-
7
-
8
-
9
-
10
-
11
-
12
-
13
-
14
-
15
-
16
-
17
-
18
-
19
-
20
-
21
-
22
-
23
-
24
-
25
-
26
-
27
-
28
-
29
-
30
-
31
-
32
-
33
-
34
-
35
-
36
-
37
-
38
-
39
-
40
-
41
-
42
-
43
-
44
-
45
-
46
-
47
-
48
-
49
-
50
-
 51
51 -
 52
52 -
 53
53 -
 54
54 -
 55
55 -
 56
56 -
 57
57 -
 58
58 -
 59
59 -
 60
60 -
 61
61 -
 62
62 -
 63
63 -
 64
64 -
 65
65 -
 66
66 -
 67
67 -
 68
68 -
 69
69 -
 70
70 -
 71
71 -
72
-
73
-
74
-
75
-
76
-
77
-
78
-
79
-
80
-
81
-
82
-
83
-
84
-
85
-
86
-
87
-
88
 |
 |
55
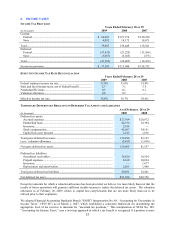
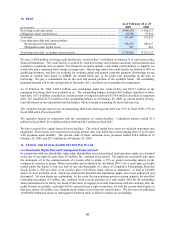
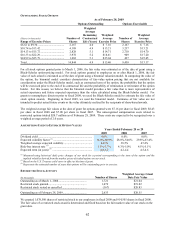
8. INCOME TAXES
INCOME TAX PROVISION
Years Ended February 28 or 29
(In thousands) 2009 2008 2007
Current:
Federal .................................................................................. $ 69,095 $ 121,274 $ 120,250
State ...................................................................................... 9,992 18,175 18,671
Total.......................................................................................... 79,087 139,449 138,921
Deferred:
Federal .................................................................................. (37,835) (21,222) (13,596)
State ...................................................................................... (3,667) (3,183) (573)
Total.......................................................................................... (41,502) (24,405) (14,169)
Income tax provision.......................................................................... $ 37,585 $ 115,044 $ 124,752
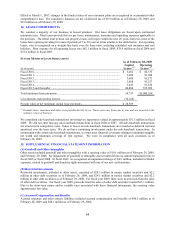
EFFECTIVE INCOME TAX RATE RECONCILIATION
Years Ended February 28 or 29
2009 2008 2007
Federal statutory income tax rate............................................... 35.0% 35.0% 35.0%
State and local income taxes, net of federal benefit................... 2.7 3.1 3.5
Nondeductible items.................................................................. 0.3 0.1 0.1
Valuation allowance .................................................................. 0.8 0.5 —
Effective income tax rate........................................................... 38.8% 38.7% 38.6%
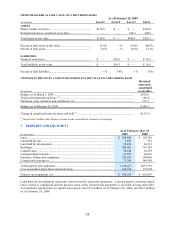
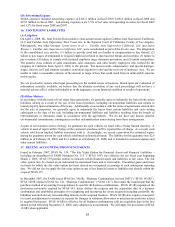
TEMPORARY DIFFERENCES RESULTING IN DEFERRED TAX ASSETS AND LIABILITIES
As of February 28 or 29
(In thousands) 2009 2008
Deferred tax assets:
Accrued expenses............................................................................................... $ 27,914 $ 28,972
Partnership basis ................................................................................................ 44,376 18,394
Inventory............................................................................................................ 2,108 —
Stock compensation ........................................................................................... 45,687 34,191
Capital loss carry forward.................................................................................. 2,413 1,636
Total gross deferred tax assets............................................................................... 122,498 83,193
Less: valuation allowance..................................................................................... (2,413) (1,636)
Net gross deferred tax assets.................................................................................. 120,085 81,557
Deferred tax liabilities:
Securitized receivables....................................................................................... 18,620 18,524
Prepaid expenses................................................................................................ 8,168 10,034
Inventory............................................................................................................ — 1,677
Depreciation and amortization ........................................................................... 2,263 1,966
Total gross deferred tax liabilities ......................................................................... 29,051 32,201
Net deferred tax asset ............................................................................................ $ 91,034 $ 49,356
Except for amounts for which a valuation allowance has been provided, we believe it is more likely than not that the
results of future operations will generate sufficient taxable income to realize the deferred tax assets. The valuation
allowance as of February 28, 2009, relates to capital loss carryforwards that are not more likely than not to be
utilized prior to their expiration.
We adopted Financial Accounting Standards Board (“FASB”) Interpretation No. 48, “Accounting for Uncertainty in
Income Taxes” (“FIN 48”) as of March 1, 2007, which established a consistent framework for determining the
appropriate level of tax reserves to maintain for “uncertain tax positions.” This interpretation of SFAS No. 109,
“Accounting for Income Taxes,” uses a two-step approach in which a tax benefit is recognized if a position is more