CarMax 2009 Annual Report Download - page 24
Download and view the complete annual report
Please find page 24 of the 2009 CarMax annual report below. You can navigate through the pages in the report by either clicking on the pages listed below, or by using the keyword search tool below to find specific information within the annual report.-
 1
1 -
2
-
3
-
4
-
5
-
6
-
7
-
8
-
9
-
10
-
11
-
12
-
13
-
 14
14 -
 15
15 -
 16
16 -
 17
17 -
 18
18 -
 19
19 -
 20
20 -
 21
21 -
 22
22 -
 23
23 -
 24
24 -
 25
25 -
 26
26 -
 27
27 -
 28
28 -
 29
29 -
 30
30 -
 31
31 -
 32
32 -
 33
33 -
 34
34 -
35
-
36
-
37
-
38
-
39
-
40
-
41
-
42
-
43
-
44
-
45
-
46
-
47
-
48
-
49
-
50
-
51
-
52
-
53
-
54
-
55
-
56
-
57
-
58
-
59
-
60
-
61
-
62
-
63
-
64
-
65
-
66
-
67
-
68
-
69
-
70
-
71
-
72
-
73
-
74
-
75
-
76
-
77
-
78
-
79
-
80
-
81
-
82
-
83
-
84
-
85
-
86
-
87
-
88
 |
 |

18
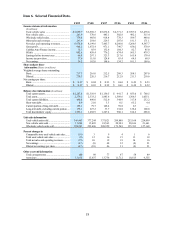
Item 6. Selected Financial Data.
FY09 FY08 FY07 FY06 FY05 FY04
Income statement information
(In millions)
Used vehicle sales .................................... $ 5,690.7 $ 6,589.3 $ 5,872.8 $ 4,771.3 $ 3,997.2 $ 3,470.6
New vehicle sales............................................ 261.9 370.6 445.1 502.8 492.1 515.4
Wholesale vehicle sales................................... 779.8 985.0 918.4 778.3 589.7 440.6
Other sales and revenues................................. 241.6 254.6 229.3 207.6 181.3 171.1
Net sales and operating revenues.............. 6,974.0 8,199.6 7,465.7 6,260.0 5,260.3 4,597.7
Gross profit ...................................................... 968.2 1,072.4 971.1 790.7 650.2 570.9
CarMax Auto Finance income........................ 15.3 85.9 132.6 104.3 82.7 85.0
SG&A ............................................................. 882.4 858.4 776.2 674.4 565.3 479.3
Earnings before income taxes......................... 96.8 297.1 323.3 217.6 165.8 178.4
Income tax provision....................................... 37.6 115.0 124.8 83.4 64.5 68.9
Net earnings..................................................... 59.2 182.0 198.6 134.2 101.3 109.6
Share and per share
information (Shares in millions)
Weighted average shares outstanding:
Basic................................................................. 217.5 216.0 212.5 209.3 208.1 207.0
Diluted.............................................................. 220.5 220.5 216.7 212.8 211.3 210.6
Net earnings per share:
Basic................................................................. $ 0.27 $ 0.84 $ 0.93 $ 0.64 $ 0.49 $ 0.53
Diluted.............................................................. $ 0.27 $ 0.83 $ 0.92 $ 0.63 $ 0.48 $ 0.52
Balance sheet information (In millions)
Total current assets.......................................... $ 1,287.8 $ 1,356.9 $ 1,150.5 $ 941.7 $ 853.0 $ 760.5
Total assets....................................................... 2,379.2 2,333.2 1,885.6 1,509.6 1,306.3 1,055.1
Total current liabilities..................................... 490.8 490.0 512.0 344.9 317.8 232.2
Short-term debt................................................ 0.9 21.0 3.3 0.5 65.2 4.4
Current portion of long-term debt................... 158.1 79.7 148.4 59.8 0.3 —
Long-term debt, excluding current portion .... 178.1 227.2 33.7 134.8 128.4 100.0
Total shareholders’ equity............................... 1,593.1 1,488.9 1,247.4 980.1 814.2 688.0
Unit sales information
Used vehicle units sold.................................... 345,465 377,244 337,021 289,888 253,168 224,099
New vehicle units sold .................................... 11,084 15,485 18,563 20,901 20,636 21,641
Wholesale vehicle units sold........................... 194,081 222,406 208,959 179,548 155,393 127,168
Percent changes in
Comparable store used vehicle unit sales....... (16) 3 9 4 1 6
Total used vehicle unit sales............................ (8) 12 16 15 13 18
Total net sales and operating revenues ........... (15) 10 19 19 14 16
Net earnings..................................................... (67) (8) 48 32 (8) 21
Diluted net earnings per share......................... (67) (10) 46 31 (8) 21
Other year-end information
Used car superstores........................................ 100 89 77 67 58 49
Associates ........................................................ 13,035 15,637 13,736 11,712 10,815 9,355