CarMax 2009 Annual Report Download - page 36
Download and view the complete annual report
Please find page 36 of the 2009 CarMax annual report below. You can navigate through the pages in the report by either clicking on the pages listed below, or by using the keyword search tool below to find specific information within the annual report.-
 1
1 -
2
-
3
-
4
-
5
-
6
-
7
-
8
-
9
-
10
-
11
-
12
-
13
-
14
-
15
-
16
-
17
-
18
-
19
-
20
-
21
-
22
-
23
-
24
-
25
-
 26
26 -
 27
27 -
 28
28 -
 29
29 -
 30
30 -
 31
31 -
 32
32 -
 33
33 -
 34
34 -
 35
35 -
 36
36 -
 37
37 -
 38
38 -
 39
39 -
 40
40 -
 41
41 -
 42
42 -
 43
43 -
 44
44 -
 45
45 -
 46
46 -
47
-
48
-
49
-
50
-
51
-
52
-
53
-
54
-
55
-
56
-
57
-
58
-
59
-
60
-
61
-
62
-
63
-
64
-
65
-
66
-
67
-
68
-
69
-
70
-
71
-
72
-
73
-
74
-
75
-
76
-
77
-
78
-
79
-
80
-
81
-
82
-
83
-
84
-
85
-
86
-
87
-
88
 |
 |

30
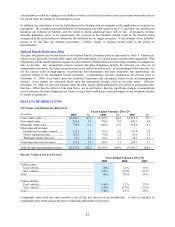
In fiscal 2008, the adjustments totaled $9.6 million, or $0.03 per share, for adjustments related to loans originated
and sold in previous fiscal years. In fiscal 2009, CAF’ s gain on sales of loans originated and sold declined to $46.5
million compared with $58.1 million in fiscal 2008. This decrease was primarily the result of the reduction in CAF
loan originations, which were adversely affected by the decreases in our used unit sales and average retail selling
price. In addition, it reflected a decrease in the percentage of sales financed by CAF resulting from our election to
slow the use of capacity in our warehouse facility during the second half of fiscal 2009. The gain percentage was
2.4% in both fiscal 2009 and fiscal 2008. Compared with the prior year, the effects of using higher loss and
discount rate assumptions and higher credit enhancement levels for fiscal 2009 originations were offset by the
benefit of a significant drop in our funding cost benchmark rate.
The increases in servicing fee income and direct CAF expenses in fiscal 2009 were proportionate to the growth in
managed receivables during the year. The interest income component of other CAF income increased to 1.2% of
average managed receivables in fiscal 2009 from 0.9% in fiscal 2008, primarily due to the increase in the discount
rate assumption used to value the retained interest. The use of a higher discount rate reduces the gain recognized at
the time the loans are sold, but increases the interest income recognized in subsequent periods. Additionally,
interest income includes the interest earned on the retained subordinated bonds. Prior to January 2008, we had not
retained any subordinated bonds.
Fiscal 2008 Versus Fiscal 2007. CAF income declined to $85.9 million in fiscal 2008 from $132.6 million in fiscal
2007. In fiscal 2008, CAF income was reduced by $9.6 million, or $0.03 per share, and they included the effects of
increasing the discount rate to 17% from 12%, increasing cumulative net loss assumptions and a $2.7 million mark-
to-market write-down of subordinated bonds. In fiscal 2007, CAF income was increased by $13.0 million, or $0.04
per share, which included the effects of reducing cumulative net loss assumptions on loans originated and sold in
previous fiscal years.
In fiscal 2008, CAF’ s gain on sales of loans originated and sold decreased to $58.1 million compared with $86.7
million in fiscal 2007. Several factors contributed to this decrease. In the second half of fiscal 2008, credit spreads
in the asset-backed securitization market widened, resulting in a substantial increase in CAF’ s funding costs. In
addition, we increased the discount rate assumption used to calculate our gain on sales of loans to 17% in fiscal 2008
from 12% in fiscal 2007, and we increased our cumulative net loss assumptions on loans originated and sold during
fiscal 2008 to a range of 2.7% to 3.0%, which was significantly higher than the cumulative net loss assumptions
used on loans originated in fiscal 2007. As a result, the gain percentage declined to 2.4% in fiscal 2008 compared
with 3.9% in fiscal 2007.
The increases in other CAF income and total direct CAF expenses in fiscal 2008 were proportionate to the growth in
managed receivables during the year.
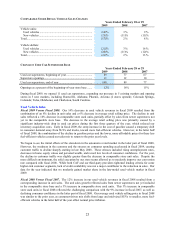
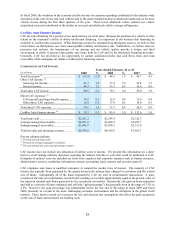
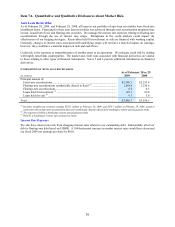
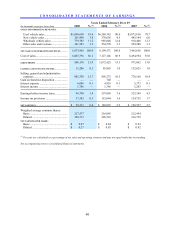
PAST DUE ACCOUNT INFORMATION
As of February 28 or 29
(In millions) 2009 2008 2007
Loans securitized ...................................................................... $ 3,831.9 $ 3,764.5 $ 3,242.1
Loans held for sale or investment............................................. 154.8 74.0 68.9
Ending managed receivables .................................................... $ 3,986.7 $ 3,838.5 $ 3,311.0
Accounts 31+ days past due ..................................................... $ 118.1 $ 86.1 $ 56.9
Past due accounts as a percentage of ending managed
receivables............................................................................. 2.96% 2.24% 1.72%
CREDIT LOSS INFORMATION
Years Ended February 28 or 29
(In millions) 2009 2008 2007
Net credit losses on managed receivables................................ $ 69.8 $ 38.3 $ 20.7
Average managed receivables ................................................. $ 4,021.0 $ 3,608.4 $ 3,071.1
Net credit losses as a percentage of average managed
receivables............................................................................ 1.74% 1.06% 0.67%
Recovery rate........................................................................... 44% 50% 51%