CarMax 2009 Annual Report Download - page 28
Download and view the complete annual report
Please find page 28 of the 2009 CarMax annual report below. You can navigate through the pages in the report by either clicking on the pages listed below, or by using the keyword search tool below to find specific information within the annual report.-
 1
1 -
2
-
3
-
4
-
5
-
6
-
7
-
8
-
9
-
10
-
11
-
12
-
13
-
14
-
15
-
16
-
17
-
 18
18 -
 19
19 -
 20
20 -
 21
21 -
 22
22 -
 23
23 -
 24
24 -
 25
25 -
 26
26 -
 27
27 -
 28
28 -
 29
29 -
 30
30 -
 31
31 -
 32
32 -
 33
33 -
 34
34 -
 35
35 -
 36
36 -
 37
37 -
 38
38 -
39
-
40
-
41
-
42
-
43
-
44
-
45
-
46
-
47
-
48
-
49
-
50
-
51
-
52
-
53
-
54
-
55
-
56
-
57
-
58
-
59
-
60
-
61
-
62
-
63
-
64
-
65
-
66
-
67
-
68
-
69
-
70
-
71
-
72
-
73
-
74
-
75
-
76
-
77
-
78
-
79
-
80
-
81
-
82
-
83
-
84
-
85
-
86
-
87
-
88
 |
 |

22
circumstances results in a change in our ability to realize our deferred tax assets, our tax provision would increase in
the period when the change in circumstances occurs.
In addition, the calculation of our tax liabilities involves dealing with uncertainties in the application of complex tax
regulations. We recognize potential liabilities for anticipated tax audit issues in the U.S. and other tax jurisdictions
based on our estimate of whether, and the extent to which, additional taxes will be due. If payments of these
amounts ultimately prove to be unnecessary, the reversal of the liabilities would result in tax benefits being
recognized in the period when we determine the liabilities are no longer necessary. If our estimate of tax liabilities
proves to be less than the ultimate assessment, a further charge to expense would result in the period of
determination.
Defined Benefit Retirement Plan
The plan obligations and related assets of our defined benefit retirement plan are presented in Note 9. Plan assets,
which consist primarily of marketable equity and debt instruments, are valued using current market quotations. Plan
obligations and the annual pension expense are determined by independent actuaries using a number of assumptions
that we provide. Key assumptions used to measure the plan obligations include the discount rate, the rate of
compensation increases, the future return on plan assets and the mortality rate. In determining the discount rate, we
use the current yield on high-quality, fixed-income debt instruments that have maturities that approximate the
expected timing of the anticipated benefit payments. Compensation increase assumptions for periods prior to
December 31, 2008, were based upon our historical experience and anticipated future board and management
actions. Asset returns are estimated based upon the anticipated average yield on the plan assets. Effective
December 31, 2008, we froze the benefits under the plan, and no additional benefits will accrue to participants after
that date. Other than the effects of the plan freeze, we do not believe that any significant changes in assumptions
used to measure the plan obligations are likely to occur that would have a material impact on our financial position
or results of operations.
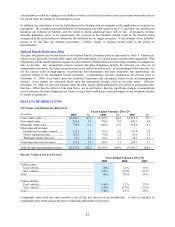
RESULTS OF OPERATIONS
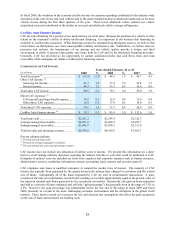
NET SALES AND OPERATING REVENUES
Years Ended February 28 or 29
(In millions) 2009 % 2008 % 2007 %
Used vehicle sales.............................. $5,690.7 81.6 $6,589.3 80.4 $5,872.8 78.7
New vehicle sales ................................... 261.9 3.8 370.6 4.5 445.1 6.0
Wholesale vehicle sales.......................... 779.8 11.2 985.0 12.0 918.4 12.3
Other sales and revenues:
Extended service plan revenues......... 125.2 1.8 132.4 1.6 114.4 1.5
Service department sales.................... 101.2 1.5 96.0 1.2 90.6 1.2
Third-party finance fees, net .............. 15.3 0.2 26.1 0.3 24.3 0.3
Total other sales and revenues........... 241.6 3.5 254.6 3.1 229.3 3.1
Total net sales and operating revenues .. $6,974.0 100.0 $8,199.6 100.0 $7,465.7 100.0
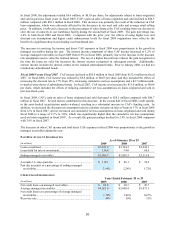
RETAIL VEHICLE SALES CHANGES
Years Ended February 28 or 29
2009 2008 2007
Vehicle units:
Used vehicles ......................................................................... (8)% 12 % 16 %
New vehicles.......................................................................... (28)% (17)% (11)%
Total........................................................................................... (9)% 10 % 14 %
Vehicle dollars:
Used vehicles ......................................................................... (14)% 12 % 23 %
New vehicles.......................................................................... (29)% (17)% (11)%
Total........................................................................................... (14)% 10 % 20 %
Comparable store used unit sales growth is one of the key drivers of our profitability. A store is included in
comparable store retail sales in the store’ s fourteenth full month of operation.