CarMax 2009 Annual Report Download - page 37
Download and view the complete annual report
Please find page 37 of the 2009 CarMax annual report below. You can navigate through the pages in the report by either clicking on the pages listed below, or by using the keyword search tool below to find specific information within the annual report.-
 1
1 -
2
-
3
-
4
-
5
-
6
-
7
-
8
-
9
-
10
-
11
-
12
-
13
-
14
-
15
-
16
-
17
-
18
-
19
-
20
-
21
-
22
-
23
-
24
-
25
-
26
-
 27
27 -
 28
28 -
 29
29 -
 30
30 -
 31
31 -
 32
32 -
 33
33 -
 34
34 -
 35
35 -
 36
36 -
 37
37 -
 38
38 -
 39
39 -
 40
40 -
 41
41 -
 42
42 -
 43
43 -
 44
44 -
 45
45 -
 46
46 -
 47
47 -
48
-
49
-
50
-
51
-
52
-
53
-
54
-
55
-
56
-
57
-
58
-
59
-
60
-
61
-
62
-
63
-
64
-
65
-
66
-
67
-
68
-
69
-
70
-
71
-
72
-
73
-
74
-
75
-
76
-
77
-
78
-
79
-
80
-
81
-
82
-
83
-
84
-
85
-
86
-
87
-
88
 |
 |
31
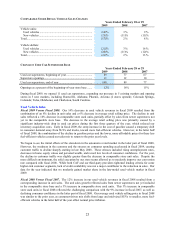
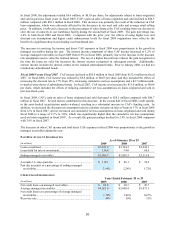
We are at risk for the performance of the managed securitized receivables to the extent of our retained interest in the
receivables. If the managed receivables do not perform in accordance with the assumptions used in determining the
fair value of the retained interest, earnings could be affected. Our retained interest was $348.3 million as of
February 28, 2009, compared with $270.8 million as of February 29, 2008.
In fiscal 2009, we experienced increases in both past due accounts as a percentage of ending managed receivables
and net credit losses as a percentage of average managed receivables. We believe these increases were primarily the
result of the recession, which has adversely affected unemployment and industry trends for losses and delinquencies.
We continually strive to refine CAF’ s origination strategy in order to optimize profitability and sales while
managing risk. Historically, we originated pools of loans targeted to have cumulative net loss rates in the range of
2.0% to 2.5%. Receivables originated in calendar years 2003, 2004 and early 2005 experienced loss rates well
below both CAF’ s historical averages and these targeted loss rates. We believe this favorability was due, in part, to
the customized credit scorecard we implemented in late 2002. As it became evident that the scorecard was resulting
in lower-than-expected loss rates, CAF gradually expanded its credit offers beginning in late 2004. As a result,
receivables originated in late 2005 and periods thereafter have experienced higher loss and delinquency rates
compared with the receivables originated in these earlier years. While the delinquency and projected loss rates on
the more recent originations have trended higher than our initial expectations, we believe this has been primarily a
reflection of the worsening economic climate. Consequently, we have increased our cumulative net loss
assumptions on several recent securitizations, and we have continued to incorporate similar economic stress into the
projections for our most recent originations. In addition, we have tightened CAF’ s lending criteria for some
applicants with higher-risk credit profiles.
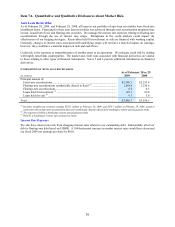
The recovery rate represents the average percentage of the outstanding principal balance we receive when a vehicle
is repossessed and liquidated at wholesale auction. Historically, the annual recovery rate has ranged from a low of
42% to a high of 51%, and it is primarily affected by changes in the wholesale market pricing environment.
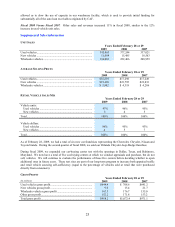
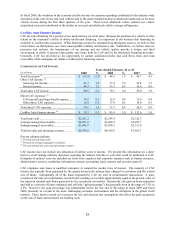
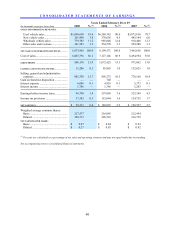
Selling, General and Administrative Expenses
SG&A expenses primarily include rent and occupancy costs; payroll expenses, other than payroll related to
reconditioning and vehicle repair service, which is included in cost of sales; fringe benefits; advertising; and other
general expenses.
Fiscal 2009 Versus Fiscal 2008. In fiscal 2009, SG&A expenses increased to $882.4 million, or 12.7% of total
revenues, from $858.4 million, or 10.5% of total revenues in fiscal 2008. During fiscal 2009, total SG&A expenses
increased only 3%, despite the 12% increase in our store base. In response to the decline in sales, we focused on
reducing store and corporate overhead costs, including payroll and advertising. Our total number of associates
declined to 13,035 as of the end of fiscal 2009 from a peak of approximately 16,400 in May 2008. The fiscal 2009
SG&A expense also reflected reductions in growth-related costs, including pre-opening and relocation costs,
resulting from the suspension of store growth. The increase in the SG&A ratio was mainly the result of the
significant declines in comparable store used unit sales and average selling price.
The fiscal 2009 SG&A expenses included a number of non-recurring items, which in the aggregate increased the
SG&A ratio by 22 basis points and reduced net earnings by $0.04 per share. These non-recurring items included
severance costs associated with reduction in our service operations workforce in October 2008, costs for the
termination of store site acquisitions resulting from our decision to temporarily suspend store growth and litigation
costs, partially offset by a benefit related to our decision to freeze our pension plan benefits as of
December 31, 2008.
Fiscal 2008 Versus Fiscal 2007. In fiscal 2008, SG&A expenses increased to $858.4 million, or 10.5% of total
revenues, from $776.2 million, or 10.4% of total revenues in fiscal 2008. During fiscal 2008, total SG&A expenses
increased 11% compared with the 16% increase in our store base. During fiscal 2008, we increased our SG&A
spending related to specific strategic, operational and Internet initiatives intended to improve customer satisfaction
and increase efficiencies over the long term. As a result, our 3% increase in comparable store used unit sales in
fiscal 2008 did not generate sufficient overhead leverage to offset the increases in spending related to our store
growth plan and these initiatives.
Income Taxes
The effective income tax rate was 38.8% in fiscal 2009, 38.7% in fiscal 2008 and 38.6% in fiscal 2007.