CarMax 2009 Annual Report Download - page 29
Download and view the complete annual report
Please find page 29 of the 2009 CarMax annual report below. You can navigate through the pages in the report by either clicking on the pages listed below, or by using the keyword search tool below to find specific information within the annual report.-
 1
1 -
2
-
3
-
4
-
5
-
6
-
7
-
8
-
9
-
10
-
11
-
12
-
13
-
14
-
15
-
16
-
17
-
18
-
 19
19 -
 20
20 -
 21
21 -
 22
22 -
 23
23 -
 24
24 -
 25
25 -
 26
26 -
 27
27 -
 28
28 -
 29
29 -
 30
30 -
 31
31 -
 32
32 -
 33
33 -
 34
34 -
 35
35 -
 36
36 -
 37
37 -
 38
38 -
 39
39 -
40
-
41
-
42
-
43
-
44
-
45
-
46
-
47
-
48
-
49
-
50
-
51
-
52
-
53
-
54
-
55
-
56
-
57
-
58
-
59
-
60
-
61
-
62
-
63
-
64
-
65
-
66
-
67
-
68
-
69
-
70
-
71
-
72
-
73
-
74
-
75
-
76
-
77
-
78
-
79
-
80
-
81
-
82
-
83
-
84
-
85
-
86
-
87
-
88
 |
 |

23
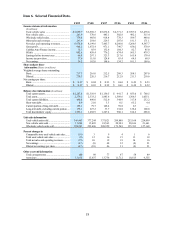
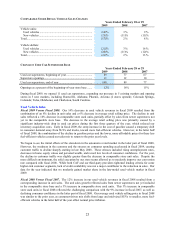
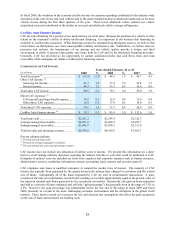
COMPARABLE STORE RETAIL VEHICLE SALES CHANGES
Years Ended February 28 or 29
2009 2008 2007
Vehicle units:
Used vehicles ......................................................................... (16)% 3 % 9 %
New vehicles.......................................................................... (25)% (11)% (11)%
Total........................................................................................... (17)% 2 % 8 %
Vehicle dollars:
Used vehicles ......................................................................... (21)% 3 % 16 %
New vehicles.......................................................................... (26)% (11)% (12)%
Total........................................................................................... (21)% 2 % 13 %
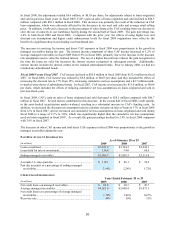
CHANGE IN USED CAR SUPERSTORE BASE
Years Ended February 28 or 29
2009 2008 2007
Used car superstores, beginning of year .................................... 89 77 67
Superstore openings................................................................... 11 12 10
Used car superstores, end of year .............................................. 100 89 77
Openings as a percent of the beginning-of-year store base ....... 12% 16% 15%
During fiscal 2009, we opened 11 used car superstores, expanding our presence in 5 existing markets and opening
stores in 5 new markets, including Huntsville, Alabama; Phoenix, Arizona (2 stores opened); Colorado Springs,
Colorado; Tulsa, Oklahoma; and Charleston, South Carolina.
Used Vehicle Sales
Fiscal 2009 Versus Fiscal 2008. Our 14% decrease in used vehicle revenues in fiscal 2009 resulted from the
combination of an 8% decline in unit sales and a 6% decrease in average retail selling price. The decline in unit
sales reflected a 16% decrease in comparable store used units, partially offset by sales from newer superstores not
yet in the comparable store base. The decrease in the average retail selling price was primarily caused by a
significant industry-wide drop in used car prices during the first three quarters of the year, which reduced our
inventory acquisition costs. Early in fiscal 2009, the steep increase in the cost of gasoline caused a temporary shift
in consumer demand away from SUVs and trucks, toward more fuel-efficient vehicles. However, in the latter half
of fiscal 2009, the combination of the decline in gasoline prices and the lower, more affordable prices for these less
fuel-efficient vehicles caused our sales mix to return to the prior year levels.
We began to see the initial effects of the slowdown in the automotive retail market in the latter part of fiscal 2008.
However, the weakness in the economy and the stresses on consumer spending accelerated in fiscal 2009, causing
customer traffic to decline sharply starting in late May 2008. These stresses included rising unemployment rates,
decreases in home equity values and personal wealth, and record low levels of consumer confidence. For the year,
the decline in customer traffic was slightly greater than the decrease in comparable store unit sales. Despite the
more difficult environment, the solid execution by our store teams allowed us to modestly improve our conversion
rate compared with fiscal 2008. While both CAF and our third-party providers tightened lending criteria for some
higher-risk customer segments, lack of credit availability was not a major contributor to the reduction in sales. Our
data for the year indicated that we modestly gained market share in the late-model used vehicle market in fiscal
2009.
Fiscal 2008 Versus Fiscal 2007. The 12% increase in our used vehicle revenues in fiscal 2008 resulted from a
corresponding increase in unit sales. The unit sales growth reflected sales from newer superstores not yet included
in the comparable store base and a 3% increase in comparable store used units. This 3% increase in comparable
store used units in fiscal 2008 reflected the challenging comparison with the 9% increase in fiscal 2007, as well as
declining consumer confidence in the latter part of fiscal 2008. Our average used vehicle selling price in fiscal 2008
was similar to the prior year, as consumer-driven mix shifts from large and mid-sized SUVs to smaller, more fuel-
efficient vehicles in the latter half of the year offset normal price inflation.