CarMax 2009 Annual Report Download - page 35
Download and view the complete annual report
Please find page 35 of the 2009 CarMax annual report below. You can navigate through the pages in the report by either clicking on the pages listed below, or by using the keyword search tool below to find specific information within the annual report.-
 1
1 -
2
-
3
-
4
-
5
-
6
-
7
-
8
-
9
-
10
-
11
-
12
-
13
-
14
-
15
-
16
-
17
-
18
-
19
-
20
-
21
-
22
-
23
-
24
-
 25
25 -
 26
26 -
 27
27 -
 28
28 -
 29
29 -
 30
30 -
 31
31 -
 32
32 -
 33
33 -
 34
34 -
 35
35 -
 36
36 -
 37
37 -
 38
38 -
 39
39 -
 40
40 -
 41
41 -
 42
42 -
 43
43 -
 44
44 -
 45
45 -
46
-
47
-
48
-
49
-
50
-
51
-
52
-
53
-
54
-
55
-
56
-
57
-
58
-
59
-
60
-
61
-
62
-
63
-
64
-
65
-
66
-
67
-
68
-
69
-
70
-
71
-
72
-
73
-
74
-
75
-
76
-
77
-
78
-
79
-
80
-
81
-
82
-
83
-
84
-
85
-
86
-
87
-
88
 |
 |

29
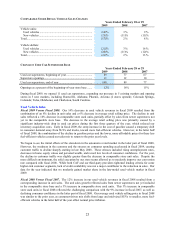
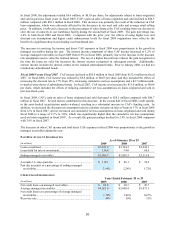
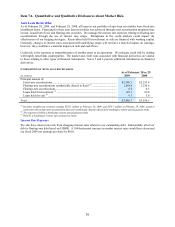
GAIN (LOSS) ON LOANS SOLD
Years Ended February 28 or 29
(In millions) 2009 2008 2007
Gain on sales of loans originated and sold (1) ........................... $ 46.5 $ 58.1 $ 86.7
Other (losses) gains(1) ............................................................... (81.8) (9.6) 13.0
Total (loss) gain........................................................................ $ (35.3) $ 48.5 $ 99.7
Loans originated and sold......................................................... $ 1,930.2 $ 2,430.8 $ 2,240.2
Receivables repurchased from term securitizations and
resold..................................................................................... 101.0 103.6 82.5
Total loans sold......................................................................... $ 2,031.2 $ 2,534.4 $ 2,322.7
Gain percentage on loans originated and sold .......................... 2.4% 2.4% 3.9%
Total (loss) gain as a percentage of total loans sold ................. (1.7)% 1.9% 4.3%
(1) To the extent we recognize valuation or other adjustments related to loans originated and sold during previous quarters of the
same fiscal year, the sum of amounts reported for the individual quarters may not equal the amounts reported for the
corresponding full fiscal year.
The gain on sales of loans originated and sold includes both the gain income recorded at the time of securitization
and the effect of any subsequent changes in valuation assumptions or funding costs that are incurred in the same
fiscal period that the loans were originated. Other losses or gains include the effects of changes in valuation
assumptions or funding costs related to loans originated and sold during previous fiscal periods. In addition, other
losses or gains could include the effects of new term securitizations, changes in the valuation of retained
subordinated bonds and the repurchase and resale of receivables in existing term securitizations, as applicable.
Our term securitizations typically contain an option to repurchase the securitized receivables when the outstanding
balance in the pool of auto loan receivables falls below 10% of the original pool balance. This option was exercised
two times in each of fiscal 2009, 2008 and 2007. In each case, the remaining eligible receivables were subsequently
resold into the warehouse facility. These transactions did not have a material effect on CAF income in fiscal 2009,
2008 or 2007. In future periods, the effects of refinancing, repurchase or resale activity could be favorable or
unfavorable, depending on the securitization structure and the market conditions at the transaction date.
Beginning in January 2008, we retained some or all of the subordinated bonds associated with our term
securitizations. These bonds were retained either because the economics of doing so were more favorable than
selling them or because there was no market for the subordinated bonds at the applicable issue date. The retained
subordinated bonds, which had total face values of $115 million and $44.7 million, respectively, at February 28,
2009, and February 29, 2008, are subject to mark-to-market adjustments.
Fiscal 2009 Versus Fiscal 2008. CAF income declined to $15.3 million in fiscal 2009 from $85.9 million in fiscal
2008. In both periods, CAF income was reduced by market-to-market write-downs and adjustments related to loans
originated in previous fiscal years. In fiscal 2009, these adjustments totaled $81.8 million, or $0.23 per share, and
they included:
• $32.0 million of mark-to-market write-downs in the carrying value of the subordinated bonds. The size of
the write-down reflected the illiquidity in the credit markets in fiscal 2009, particularly for subordinated
bonds. This non-cash charge primarily affects the timing of the recognition of CAF income. Assuming
current conditions persist, the mark-to-market write downs should reverse as we get closer to the maturity
dates of the underlying bonds, resulting in positive contributions to CAF income in future periods.
• $31.8 million for increases in cumulative net loss rate assumptions. The upper end of our cumulative net
loss rate assumption range was 4.0% at the end of fiscal 2009 versus 3.0% at the end of fiscal 2008.
• $18.0 million for increases in funding costs related to loans originated in prior fiscal years. The majority of
this increase related to loans that were securitized in the warehouse facility at the end of fiscal 2008 and
which were subsequently resold in term securitizations during fiscal 2009.
• $3.8 million for increasing the discount rate assumption to 19% from 17%.
• Partly offset by $3.8 million of net favorable adjustments primarily related to reducing our prepayment rate
assumption.