CarMax 2009 Annual Report Download - page 53
Download and view the complete annual report
Please find page 53 of the 2009 CarMax annual report below. You can navigate through the pages in the report by either clicking on the pages listed below, or by using the keyword search tool below to find specific information within the annual report.-
 1
1 -
2
-
3
-
4
-
5
-
6
-
7
-
8
-
9
-
10
-
11
-
12
-
13
-
14
-
15
-
16
-
17
-
18
-
19
-
20
-
21
-
22
-
23
-
24
-
25
-
26
-
27
-
28
-
29
-
30
-
31
-
32
-
33
-
34
-
35
-
36
-
37
-
38
-
39
-
40
-
41
-
42
-
 43
43 -
 44
44 -
 45
45 -
 46
46 -
 47
47 -
 48
48 -
 49
49 -
 50
50 -
 51
51 -
 52
52 -
 53
53 -
 54
54 -
 55
55 -
 56
56 -
 57
57 -
 58
58 -
 59
59 -
 60
60 -
 61
61 -
 62
62 -
 63
63 -
64
-
65
-
66
-
67
-
68
-
69
-
70
-
71
-
72
-
73
-
74
-
75
-
76
-
77
-
78
-
79
-
80
-
81
-
82
-
83
-
84
-
85
-
86
-
87
-
88
 |
 |

47
(S) Net Earnings Per Share
Basic net earnings per share is computed by dividing net earnings by the weighted average number of shares of
common stock outstanding. Diluted net earnings per share is computed by dividing net earnings by the sum of the
weighted average number of shares of common stock outstanding and dilutive potential common stock.
(T) Risks and Uncertainties
We sell used and new vehicles. The diversity of our customers and suppliers and the highly fragmented nature of
the U.S. automotive retail market reduce the risk that near term changes in our customer base, sources of supply or
competition will have a severe impact on our business. However, unanticipated events could have an adverse effect
on our business, results of operations and financial condition.
(U) Reclassifications
Certain prior year amounts have been reclassified to conform to the current year’ s presentation with no effect on net
earnings.
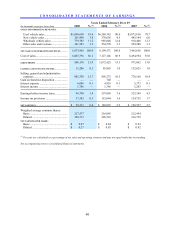
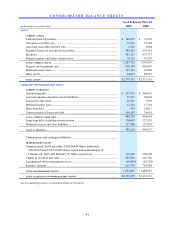
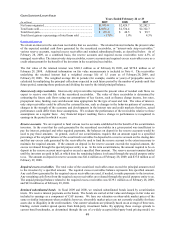
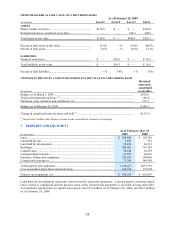
3. CARMAX AUTO FINANCE INCOME
Years Ended February 28 or 29
(In millions) 2009 2008 2007
Gain on sales of loans originated and sold (1) ............................ $ 46.5 $ 58.1 $ 86.7
Other (losses) gains (1) ............................................................... (81.8) (9.6) 13.0
Total (loss) gain......................................................................... (35.3) 48.5 99.7
Other CAF income:
Servicing fee income .............................................................. 41.3 37.4 32.4
Interest income ....................................................................... 48.3 33.3 26.6
Total other CAF income ............................................................ 89.6 70.7 59.0
Direct CAF expenses:
CAF payroll and fringe benefit expense................................. 19.2 15.9 12.0
Other direct CAF expenses..................................................... 19.9 17.4 14.0
Total direct CAF expenses......................................................... 39.1 33.3 26.0
CarMax Auto Finance income................................................... $ 15.3 $ 85.9 $132.6
(1) To the extent we recognize valuation or other adjustments related to loans originated and sold during previous quarters of the
same fiscal year, the sum of amounts reported for the individual quarters may not equal the amounts reported for the
corresponding full fiscal year.
CAF provides financing for qualified customers at competitive market rates of interest. Throughout each month, we
sell substantially all of the loans originated by CAF in securitization transactions as discussed in Note 4. The
majority of CAF income has typically been generated by the spread between the interest rates charged to customers
and the related cost of funds. A gain, recorded at the time of securitization, results from recording a receivable
approximately equal to the present value of the expected residual cash flows generated by the securitized
receivables. The cash flows are calculated taking into account expected prepayments, losses and funding costs.
The gain on sales of loans originated and sold includes both the gain income recorded at the time of securitization
and the effect of any subsequent changes in valuation assumptions or funding costs that are incurred in the same
fiscal period that the loans were originated. Other losses or gains include the effects of changes in valuation
assumptions or funding costs related to loans originated and sold during previous fiscal periods. In addition, other
losses or gains could include the effects of new term securitizations, changes in the valuation of retained
subordinated bonds and the repurchase and resale of receivables in existing term securitizations, as applicable.
CAF income does not include any allocation of indirect costs or income. We present this information on a direct
basis to avoid making arbitrary decisions regarding the indirect benefit or costs that could be attributed to CAF.
Examples of indirect costs not included are retail store expenses and corporate expenses such as human resources,
administrative services, marketing, information systems, accounting, legal, treasury and executive payroll.