CarMax 2009 Annual Report Download - page 64
Download and view the complete annual report
Please find page 64 of the 2009 CarMax annual report below. You can navigate through the pages in the report by either clicking on the pages listed below, or by using the keyword search tool below to find specific information within the annual report.-
 1
1 -
2
-
3
-
4
-
5
-
6
-
7
-
8
-
9
-
10
-
11
-
12
-
13
-
14
-
15
-
16
-
17
-
18
-
19
-
20
-
21
-
22
-
23
-
24
-
25
-
26
-
27
-
28
-
29
-
30
-
31
-
32
-
33
-
34
-
35
-
36
-
37
-
38
-
39
-
40
-
41
-
42
-
43
-
44
-
45
-
46
-
47
-
48
-
49
-
50
-
51
-
52
-
53
-
 54
54 -
 55
55 -
 56
56 -
 57
57 -
 58
58 -
 59
59 -
 60
60 -
 61
61 -
 62
62 -
 63
63 -
 64
64 -
 65
65 -
 66
66 -
 67
67 -
 68
68 -
 69
69 -
 70
70 -
 71
71 -
 72
72 -
 73
73 -
 74
74 -
75
-
76
-
77
-
78
-
79
-
80
-
81
-
82
-
83
-
84
-
85
-
86
-
87
-
88
 |
 |
58
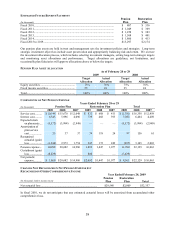
ESTIMATED FUTURE BENEFIT PAYMENTS
(In thousands)
Pension
Plan
Restoration
Plan
Fiscal 2010............................................................................................................... $ 807 $ 336
Fiscal 2011............................................................................................................... $ 1,049 $ 369
Fiscal 2012............................................................................................................... $ 1,258 $ 383
Fiscal 2013............................................................................................................... $ 1,508 $ 401
Fiscal 2014............................................................................................................... $ 1,800 $ 413
Fiscal 2015 to 2019.................................................................................................. $ 13,297 $ 2,174
Our pension plan assets are held in trust and management sets the investment policies and strategies. Long-term
strategic investment objectives include asset preservation and appropriately balancing risk and return. We oversee
the investment allocation process, which includes selecting investment managers, setting long-term strategic targets
and monitoring asset allocations and performance. Target allocations are guidelines, not limitations, and
occasionally plan fiduciaries will approve allocations above or below the targets.
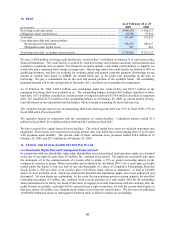
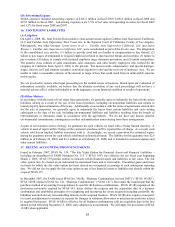
PENSION PLAN ASSET ALLOCATION
As of February 28 or 29
2009 2008
Target Actual Target Actual
Allocation Allocation Allocation Allocation
Equity securities ................................................ 75% 76% 75% 76%
Fixed income securities ..................................... 25 24 25 24
Total................................................................... 100% 100% 100% 100%
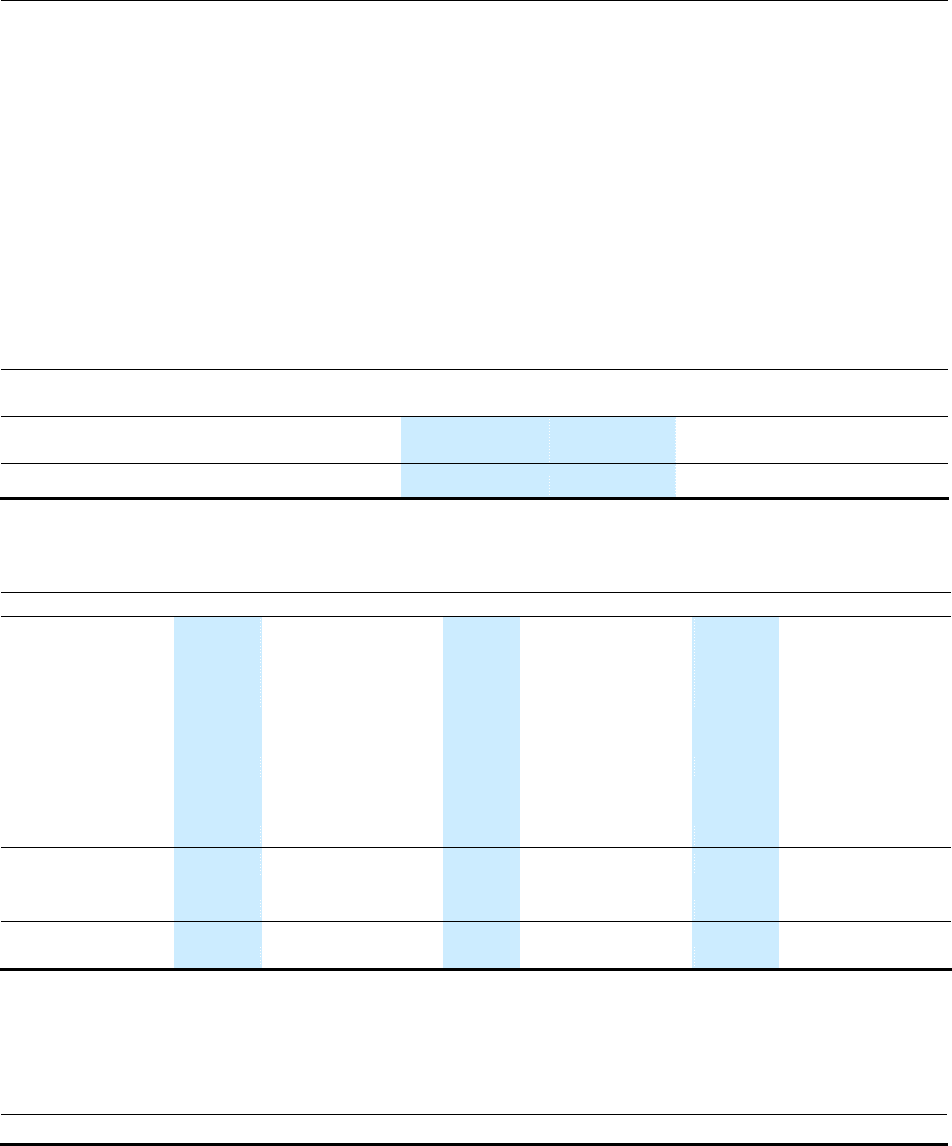
COMPONENTS OF NET PENSION EXPENSE
Years Ended February 28 or 29
(In thousands) Pension Plan Restoration Plan Total
2009 2008 2007 2009 2008 2007 2009 2008 2007
Service cost.......... $ 10,548 $ 15,670 $ 12,048 $ 832 $ 688 $ 411 $ 11,380 $ 16,358 $ 12,459
Interest cost.......... 6,343 5,996 4,096 739 468 393 7,082 6,464 4,489
Expected return
on plan assets .... (5,572) (3,994) (2,949) —— — (5,572) (3,994) (2,949)
Amortization of
prior service
cost ................. 23 37 37 74 119 24 97 156 61
Recognized
actuarial (gain)
loss ................. (1,244) 2,973 1,754 247 172 249 (997) 3,145 2,003
Pension expense... 10,098 20,682 14,986 1,892 1,447 1,077 11,990 22,129 16,063
Curtailment (gain)
loss ................. (8,229) — — 800 — — (7,429) — —
Net periodic
expense........... $ 1,869 $ 20,682 $ 14,986 $ 2,692 $ 1,447 $ 1,077 $ 4,561 $ 22,129 $ 16,063
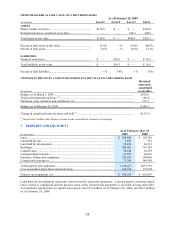
CHANGES NOT RECOGNIZED IN NET PENSION EXPENSE BUT
RECOGNIZED IN OTHER COMPREHENSIVE INCOME
Year Ended February 28, 2009
(In thousands, before income taxes)
Pension
Plan
Restoration
Plan Total
Net actuarial loss .............................................................................. $29,548 $2,809 $32,357
In fiscal 2010, we do not anticipate that any estimated actuarial losses will be amortized from accumulated other
comprehensive loss.