CarMax 2009 Annual Report Download - page 32
Download and view the complete annual report
Please find page 32 of the 2009 CarMax annual report below. You can navigate through the pages in the report by either clicking on the pages listed below, or by using the keyword search tool below to find specific information within the annual report.-
 1
1 -
2
-
3
-
4
-
5
-
6
-
7
-
8
-
9
-
10
-
11
-
12
-
13
-
14
-
15
-
16
-
17
-
18
-
19
-
20
-
21
-
 22
22 -
 23
23 -
 24
24 -
 25
25 -
 26
26 -
 27
27 -
 28
28 -
 29
29 -
 30
30 -
 31
31 -
 32
32 -
 33
33 -
 34
34 -
 35
35 -
 36
36 -
 37
37 -
 38
38 -
 39
39 -
 40
40 -
 41
41 -
 42
42 -
43
-
44
-
45
-
46
-
47
-
48
-
49
-
50
-
51
-
52
-
53
-
54
-
55
-
56
-
57
-
58
-
59
-
60
-
61
-
62
-
63
-
64
-
65
-
66
-
67
-
68
-
69
-
70
-
71
-
72
-
73
-
74
-
75
-
76
-
77
-
78
-
79
-
80
-
81
-
82
-
83
-
84
-
85
-
86
-
87
-
88
 |
 |

26
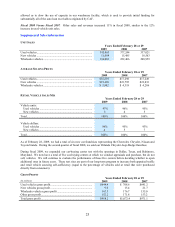
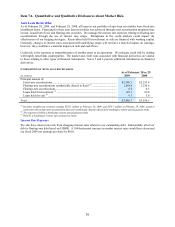
GROSS PROFIT PER UNIT
Years Ended February 28 or 29
2009 2008 2007
$ per unit (1) % (2) $ per unit (1) % (2) $ per unit (1) % (2)
Used vehicle gross profit .............. $1,865 11.3 $1,878 10.8 $1,903 10.9
New vehicle gross profit............... $ 814 3.4 $ 994 4.2 $1,169 4.9
Wholesale vehicle gross profit...... $ 837 20.8 $ 794 17.9 $ 742 16.9
Other gross profit.......................... $ 427 63.0 $ 437 67.5 $ 431 66.8
Total gross profit .......................... $2,715 13.9 $2,731 13.1 $2,731 13.0
(1) Calculated as category gross profit divided by its respective units sold, except the other and total categories, which are
divided by total retail units sold.
(2) Calculated as a percentage of its respective sales or revenue.
Used Vehicle Gross Profit
We target a dollar range of gross profit per used unit sold. The gross profit dollar target for an individual vehicle is
based on a variety of factors, including its anticipated probability of sale and its mileage relative to its age; however,
it is not primarily based on the vehicle’ s selling price. Our ability to quickly adjust appraisal offers to be consistent
with the broader market trade-in trends and our rapid inventory turns reduce the exposure to the inherent continual
depreciation in used vehicle values and contribute to our ability to manage gross profit dollars per unit. We employ
a volume-based strategy, and we systematically mark down individual vehicle prices based on proprietary pricing
algorithms in order to appropriately balance sales trends, inventory turns and gross profit achievement. When
customer traffic and sales are consistently strong, we generally take fewer pricing markdowns, which in turn
benefits gross profit dollars per unit. When the sales pace slows, we may initially take more pricing markdowns,
which could pressure gross profit dollars per unit. However, as we are successful in reducing inventories to align
them with a slower sales pace, this may allow us to return to target levels of gross profit per unit. Over the past
several years, we have continued to refine our car-buying strategies, which we believe has benefited used vehicle
gross profit per unit.
Fiscal 2009 Versus Fiscal 2008. Our used vehicle gross profit decreased by $64.2 million, or 9%, to $644.4 million
from $708.6 million in fiscal 2008, primarily as a result of the 8% decline in total used unit sales. Despite the
difficult sales environment in fiscal 2009, gross profit per unit decreased only $13 to $1,865 per unit. Several
factors adversely affected our fiscal 2009 used vehicle gross profit per unit, including a reduction in the percent of
vehicles purchased directly from customers and the sharp decrease in wholesale industry prices. These were largely
offset, however, by our success in managing our inventories.
During fiscal 2009, we experienced a decline in both appraisal traffic and buy rate, which required us to source a
larger percentage of our used vehicles at auction. Vehicles purchased at auction typically generate less gross profit
per unit compared with vehicles purchased directly from consumers. Additionally, wholesale industry prices for
mid-sized and large SUVs and trucks declined sharply in the spring and early summer of 2008, and this rapid
decline in valuation resulted in margin pressure on this segment of inventory in the first half of fiscal 2009.
We believe that our ability to maintain a generally consistent level of gross profit per unit during fiscal 2009, despite
the challenging sales environment and the unprecedented decline in wholesale market prices, was due in large part
to the effectiveness of our proprietary inventory management systems and processes. In response to the sharp
decline in traffic and sales that began in late May 2008, we rapidly reduced our used car inventories, which brought
them back in line with the current sales rates and minimized required pricing markdowns in the second half of the
fiscal year. Compared with inventory levels at stores open as of February 29, 2008, we had approximately 16,500
fewer total used vehicle units in inventory as of February 28, 2009, representing a 28% reduction. Due to the severe
decline in customer traffic during fiscal 2009, we generally chose not to reduce our gross profit targets, as we
believed doing so in the current economic environment would not have spurred a sufficient increase in sales to offset
the reduction in per-unit profitability.
Fiscal 2008 Versus Fiscal 2007. Our used vehicle gross profit increased by $67.4 million, or 11%, to $708.6
million from $641.2 million in fiscal 2007, primarily as a result of the 12% increase in total used unit sales. Our
used vehicle gross profit per unit declined $25 to $1,878 per unit in fiscal 2008. The gross profit per unit increased
modestly in the first half of the year before declining in the second half of the year. As the economic environment
continued to weaken in the third quarter of fiscal 2008, we moderately reduced our gross profit targets at the
beginning of the fourth quarter in an attempt to create additional value for customers and drive sales.