CarMax 2009 Annual Report Download - page 60
Download and view the complete annual report
Please find page 60 of the 2009 CarMax annual report below. You can navigate through the pages in the report by either clicking on the pages listed below, or by using the keyword search tool below to find specific information within the annual report.-
 1
1 -
2
-
3
-
4
-
5
-
6
-
7
-
8
-
9
-
10
-
11
-
12
-
13
-
14
-
15
-
16
-
17
-
18
-
19
-
20
-
21
-
22
-
23
-
24
-
25
-
26
-
27
-
28
-
29
-
30
-
31
-
32
-
33
-
34
-
35
-
36
-
37
-
38
-
39
-
40
-
41
-
42
-
43
-
44
-
45
-
46
-
47
-
48
-
49
-
 50
50 -
 51
51 -
 52
52 -
 53
53 -
 54
54 -
 55
55 -
 56
56 -
 57
57 -
 58
58 -
 59
59 -
 60
60 -
 61
61 -
 62
62 -
 63
63 -
 64
64 -
 65
65 -
 66
66 -
 67
67 -
 68
68 -
 69
69 -
 70
70 -
71
-
72
-
73
-
74
-
75
-
76
-
77
-
78
-
79
-
80
-
81
-
82
-
83
-
84
-
85
-
86
-
87
-
88
 |
 |

54
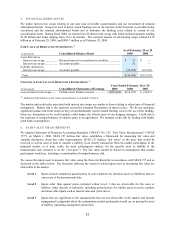
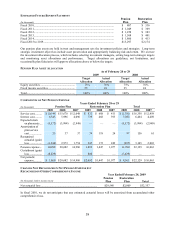
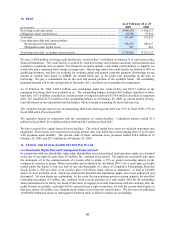
ITEMS MEASURED AT FAIR VALUE ON A RECURRING BASIS
As of February 28, 2009
(In millions) Level 1 Level 2 Level 3 Total
ASSETS
Money market securities.......................................................... $156.8 $ — $ — $156.8
Retained interest in securitized receivables ............................. — — 348.3 348.3
Total assets at fair value .......................................................... $156.8 $ — $348.3 $505.1
Percent of total assets at fair value........................................... 31.0% — % 69.0% 100.0%
Percent of total assets .............................................................. 6.6% — % 14.6% 21.2%
LIABILITIES
Financial derivatives................................................................ $ — $ 30.5 $ — $ 30.5
Total liabilities at fair value..................................................... $ — $ 30.5 $ — $ 30.5
Percent of total liabilities......................................................... — % 3.9% — % 3.9%
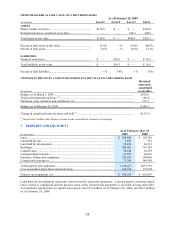
CHANGES IN THE LEVEL 3 ASSETS MEASURED AT FAIR VALUE ON A RECURRING BASIS
(In millions)
Retained
interest in
securitized
receivables
Balance as of March 1, 2009 .............................................................................................................. $ 270.8
Total realized/unrealized losses (1) ...................................................................................................... (46.4)
Purchases, sales, issuances and settlements, net ................................................................................. 123.9
Balance as of February 28, 2009 ........................................................................................................ $ 348.3
Change in unrealized losses on assets still held (1).............................................................................. $ (33.5)
(1) Reported in CarMax Auto Finance income on the consolidated statements of earnings.
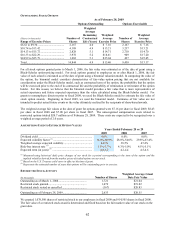
7. PROPERTY AND EQUIPMENT
As of February 28 or 29
(In thousands) 2009 2008
Land........................................................................................................................ $ 198,809 $ 162,786
Land held for sale ................................................................................................... 1,432 921
Land held for development..................................................................................... 38,200 42,311
Buildings................................................................................................................. 509,682 397,183
Capital leases .......................................................................................................... 30,640 29,258
Leasehold improvements........................................................................................ 83,823 64,947
Furniture, fixtures and equipment........................................................................... 230,552 199,996
Construction in progress......................................................................................... 71,289 140,389
Total property and equipment................................................................................. 1,164,427 1,037,791
Less accumulated depreciation and amortization ............................................................. 226,168 175,294
Property and equipment, net................................................................................... $ 938,259 $ 862,497
Land held for development represents land owned for potential expansion. Leased property meeting capital
lease criteria is capitalized and the present value of the related lease payments is recorded as long-term debt.
Accumulated amortization on capital lease assets was $7.9 million as of February 28, 2009, and $6.2 million
as of February 29, 2008.