CarMax 2009 Annual Report Download - page 4
Download and view the complete annual report
Please find page 4 of the 2009 CarMax annual report below. You can navigate through the pages in the report by either clicking on the pages listed below, or by using the keyword search tool below to find specific information within the annual report.-
 1
1 -
 2
2 -
 3
3 -
 4
4 -
 5
5 -
 6
6 -
 7
7 -
 8
8 -
 9
9 -
 10
10 -
 11
11 -
 12
12 -
 13
13 -
 14
14 -
 15
15 -
16
-
17
-
18
-
19
-
20
-
21
-
22
-
23
-
24
-
25
-
26
-
27
-
28
-
29
-
30
-
31
-
32
-
33
-
34
-
35
-
36
-
37
-
38
-
39
-
40
-
41
-
42
-
43
-
44
-
45
-
46
-
47
-
48
-
49
-
50
-
51
-
52
-
53
-
54
-
55
-
56
-
57
-
58
-
59
-
60
-
61
-
62
-
63
-
64
-
65
-
66
-
67
-
68
-
69
-
70
-
71
-
72
-
73
-
74
-
75
-
76
-
77
-
78
-
79
-
80
-
81
-
82
-
83
-
84
-
85
-
86
-
87
-
88
 |
 |
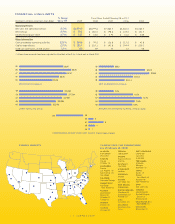
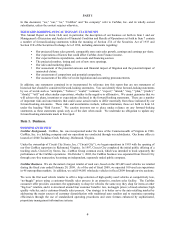
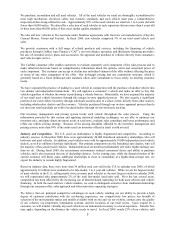
FINANCIAL HIGHLIGHTS
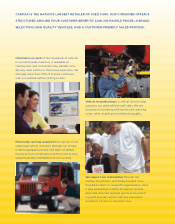
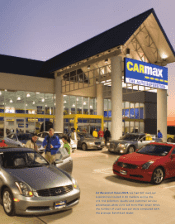
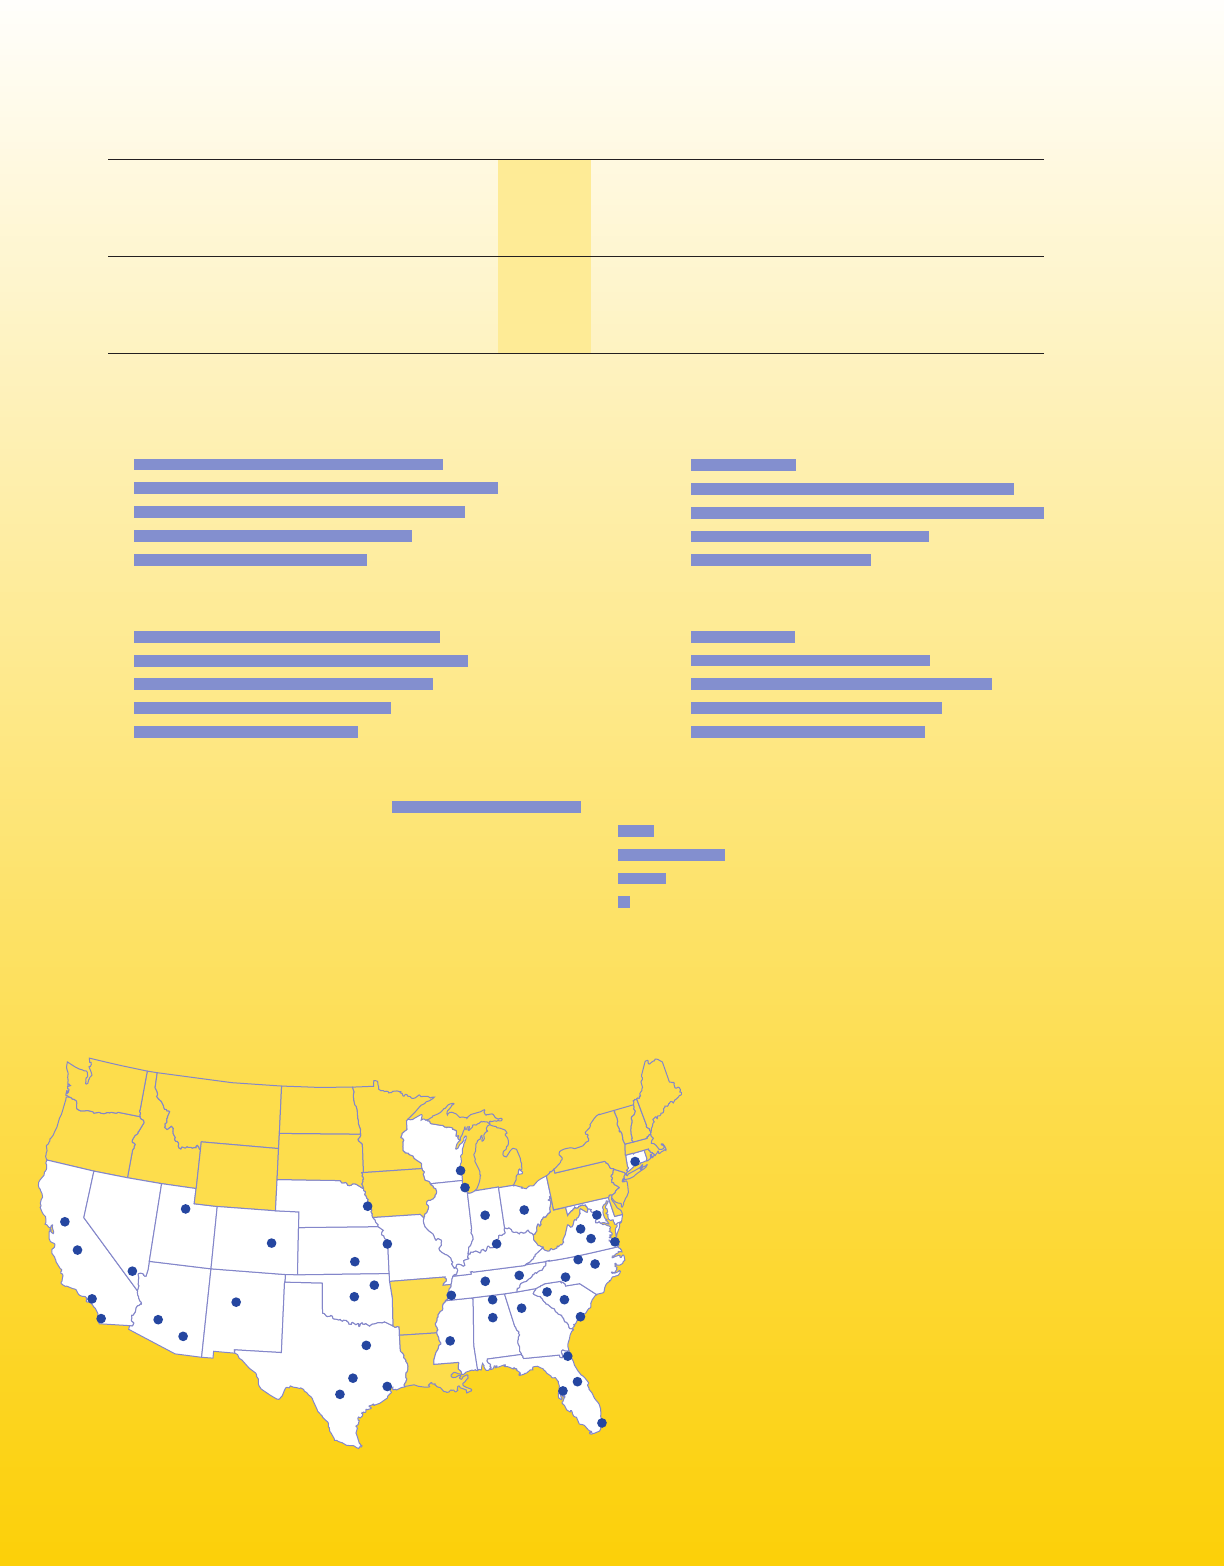
CARMAX MARKETS CARMAX USED CAR SUPERSTORES
(As of February 28, 2009)
ALABAMA
Birmingham
Huntsville
ARIZONA
Tucson
Phoenix (2)
CALIFORNIA
Fresno
Los Angeles (9)
Sacramento (2)
San Diego
COLORADO
Colorado Springs
CONNECTICUT
Hartford/
New Haven (2)
FLORIDA
Jacksonville
Miami (5)
Orlando (2)
Tampa (2)
GEORGIA
Atlanta (5)
ILLINOIS
Chicago (8)
INDIANA
Indianapolis
KANSAS
Kansas City (2)
Wichita
KENTUCKY
Louisville
MISSISSIPPI
Jackson
NEBRASKA
Omaha
NEVADA
Las Vegas (2)
NEW MEXICO
Albuquerque
NORTH CAROLINA
Charlotte (4)
Greensboro (2)
Raleigh (2)
OHIO
Columbus (2)
OKLAHOMA
Oklahoma City
Tulsa
SOUTH CAROLINA
Charleston
Columbia
Greenville
TENNESSEE
Knoxville
Memphis
Nashville (2)
TEXAS
Austin (2)
Dallas/
Fort Worth (4)
Houston (4)
San Antonio (2)
UTAH
Salt Lake City
VIRGINIA
Charlottesville
Norfolk/Virginia
Beach (2)
Richmond (2)
WASHINGTON, D.C./
BALTIMORE (7)
WISCONSIN
Milwaukee (2)
09
08
07
06
05
345,465
377,244
337,021
289,888
253,168
09
08
07
06
05
(16)
3
9
4
1
09
08
07
06
05
$59.2
$182.0
$198.6
$134.2
$101.3
09
08
07
06
05
4.4%
10.1%
12.7%
10.6%
9.9%
RETURN ON INVESTED CAPITAL (Unleveraged)
REVENUES (In billions) NET EARNINGS (In millions)
COMPARABLE STORE USED UNIT SALES (Percentage change)
USED VEHICLES SOLD
09
08
07
06
05 $5.26
$6.26
$7.47
$8.20
$6.97
% Change Fiscal Years Ended February 28 or 29 (1)
(Dollars in millions except per share data) ’08 to ’09 2009 2008 2007 2006 2005
Operating Results
Net sales and operating revenues (15)% $6,974.0 $8,199.6 $7,465.7 $6,260.0 $5,260.3
Net earnings (67)% $ 59.2 $ 182.0 $ 198.6 $ 134.2 $ 101.3
Diluted earnings per share (67)% $ 0.27 $ 0.83 $ 0.92 $ 0.63 $ 0.48
Other Information
Cash provided by operating activities 233 % $ 264.6 $ 79.5 $ 136.8 $ 117.5 $ 41.8
Capital expenditures (27)% $ 185.7 $ 253.1 $ 191.8 $ 194.4 $ 230.1
Used car superstores, at end of year 12 % 100 89 77 67 58
(1)
All per share amounts have been adjusted for the effect of the 2-for-1 stock split in March 2007.
2| CARMAX 2009