CarMax 2009 Annual Report Download - page 26
Download and view the complete annual report
Please find page 26 of the 2009 CarMax annual report below. You can navigate through the pages in the report by either clicking on the pages listed below, or by using the keyword search tool below to find specific information within the annual report.-
 1
1 -
2
-
3
-
4
-
5
-
6
-
7
-
8
-
9
-
10
-
11
-
12
-
13
-
14
-
15
-
 16
16 -
 17
17 -
 18
18 -
 19
19 -
 20
20 -
 21
21 -
 22
22 -
 23
23 -
 24
24 -
 25
25 -
 26
26 -
 27
27 -
 28
28 -
 29
29 -
 30
30 -
 31
31 -
 32
32 -
 33
33 -
 34
34 -
 35
35 -
 36
36 -
37
-
38
-
39
-
40
-
41
-
42
-
43
-
44
-
45
-
46
-
47
-
48
-
49
-
50
-
51
-
52
-
53
-
54
-
55
-
56
-
57
-
58
-
59
-
60
-
61
-
62
-
63
-
64
-
65
-
66
-
67
-
68
-
69
-
70
-
71
-
72
-
73
-
74
-
75
-
76
-
77
-
78
-
79
-
80
-
81
-
82
-
83
-
84
-
85
-
86
-
87
-
88
 |
 |
20
We are still at a relatively early stage in the national rollout of our retail concept, and as of February 28, 2009, we
had used car superstores located in markets that comprised approximately 45% of the U.S. population. Prior to
August 2008, we had planned to open used car superstores at a rate of approximately 15% of our used car superstore
base each year. In August 2008, we announced that we would temporarily slow our store growth as a result of the
weak economic and sales environment. In December 2008, following further deterioration in market conditions we
announced a temporary suspension in store growth. We believe this suspension will reduce our capital needs and
improve profitability.
In the near term, our principal challenges are related to the recession, which caused a dramatic decline in industry-
wide auto sales, and the disruption of the asset-backed securitization market, which historically has been used to
provide funding for CAF loan originations. In fiscal 2009, we experienced a large decline in customer traffic, which
led to significant reductions in our sales and gross profits and caused the deleveraging of our selling, general and
administrative expenses. A decline in investor interest in asset-backed securities caused us to slow CAF’ s share of
originations in the second half of fiscal 2009, in an effort to slow the utilization of our warehouse facility.
Longer term, when economic conditions improve and we resume geographic growth, we believe the principal
challenges we face will include our ability to build our management bench strength to support the store growth and
our ability to procure suitable real estate at reasonable costs. We staff each newly opened store with an experienced
management team. Therefore, when we are expanding our store base, we must recruit, train and develop managers
and associates to fill the pipeline necessary to support future store openings.
Fiscal 2009 Highlights
• We believe the weakness in the economy and the stresses on consumer spending caused by the recession
adversely affected industry-wide auto sales in fiscal 2009.
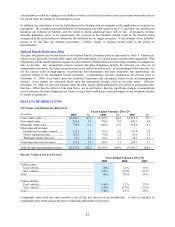
• Net sales and operating revenues decreased 15% to $6.97 billion from $8.20 billion in fiscal 2008, while net
earnings decreased to $59.2 million, or $0.27 per share, from $182.0 million, or $0.83 per share.
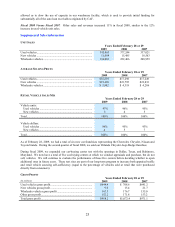
• Total used vehicle revenues declined 14% to $5.69 billion versus $6.59 billion in fiscal 2008. Total used
vehicle unit sales decreased 8%, reflecting the combination of a 16% decrease in comparable store used unit
sales partially offset by the growth in our store base. The average used vehicle selling price declined 6%,
primarily as a result of a decline in acquisition costs caused by the weak wholesale vehicle market.
• We opened 11 used car superstores in fiscal 2009, increasing our store base by 12%. We expanded our
presence in five existing markets and we entered five new markets.
• Total wholesale vehicle revenues decreased 21% to $779.8 million versus $985.0 million in fiscal 2008,
reflecting the combination of a 13% decline in wholesale unit sales and a 10% decline in average wholesale
selling price. The decline in unit sales reflected a decrease in both our appraisal traffic and our appraisal buy
rate (defined as the number of appraisal purchases as a percent of the number of vehicles appraised).
• Our total gross profit decreased to $968.2 million compared with $1.07 billion in fiscal 2008, primarily because
of the significant decline in used and wholesale unit sales. Despite the difficult sales environment, our total
gross profit dollars per unit decreased only $16 to $2,715 per unit from $2,731 per unit in fiscal 2008. We
believe our ability to maintain a generally consistent level of gross profit per unit, despite the challenging sales
environment and an unprecedented decline in wholesale market prices in fiscal 2009, was due in large part to
the effectiveness of our proprietary inventory management systems and processes and our success in
dramatically reducing inventories to keep them aligned with sales.
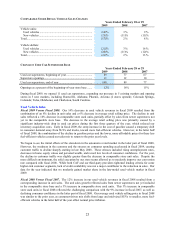
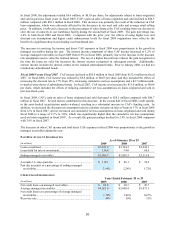
• CAF income decreased to $15.3 million compared with $85.9 million in fiscal 2008. In both periods, CAF
results were reduced by adjustments related to loans originated in previous fiscal years. The adjustments totaled
$81.8 million, or $0.23 per share, in fiscal 2009 and $9.6 million, or $0.03 per share, in fiscal 2008. The fiscal
2009 adjustments included approximately $32.0 million of mark-to-market write-downs on subordinated bonds,
$31.8 million for increased cumulative net loss assumptions and $18.0 million for increased funding costs.
CAF’ s gain on loans originated and sold declined to $46.5 million compared with $58.1 million in fiscal 2008.
In fiscal 2009, CAF’ s loan origination volume was adversely affected by the decreases in our used unit sales
and average selling price and a decrease in the percentage of sales financed by CAF.
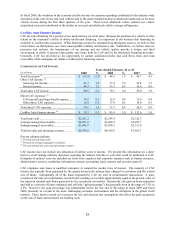
• Selling, general and administrative (“SG&A”) expenses increased 3% to $882.4 million from $858.4 million in
fiscal 2008, significantly less than the 12% increase in our store base. SG&A as a percent of net sales and
operating revenues (the “SG&A ratio”), increased to 12.7% from 10.5% in fiscal 2008 reflecting the significant
declines in comparable store used unit sales and average selling price, partially offset by reductions in variable
costs.
• Net cash provided by operating activities increased to $264.6 million compared with $79.5 million in fiscal
2008, primarily reflecting the large reduction in used vehicle inventories in fiscal 2009, partially offset by the
decrease in net earnings.