CarMax 2009 Annual Report Download - page 30
Download and view the complete annual report
Please find page 30 of the 2009 CarMax annual report below. You can navigate through the pages in the report by either clicking on the pages listed below, or by using the keyword search tool below to find specific information within the annual report.-
 1
1 -
2
-
3
-
4
-
5
-
6
-
7
-
8
-
9
-
10
-
11
-
12
-
13
-
14
-
15
-
16
-
17
-
18
-
19
-
 20
20 -
 21
21 -
 22
22 -
 23
23 -
 24
24 -
 25
25 -
 26
26 -
 27
27 -
 28
28 -
 29
29 -
 30
30 -
 31
31 -
 32
32 -
 33
33 -
 34
34 -
 35
35 -
 36
36 -
 37
37 -
 38
38 -
 39
39 -
 40
40 -
41
-
42
-
43
-
44
-
45
-
46
-
47
-
48
-
49
-
50
-
51
-
52
-
53
-
54
-
55
-
56
-
57
-
58
-
59
-
60
-
61
-
62
-
63
-
64
-
65
-
66
-
67
-
68
-
69
-
70
-
71
-
72
-
73
-
74
-
75
-
76
-
77
-
78
-
79
-
80
-
81
-
82
-
83
-
84
-
85
-
86
-
87
-
88
 |
 |
24
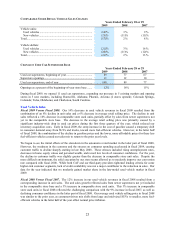
In fiscal 2008, we experienced an overall increase in consumer traffic, which we believe was a benefit of the
strength of our consumer offer, as well as a favorable response to improvements made to carmax.com. However,
compared with fiscal 2007, our sales conversion rate declined slightly as consumers appeared to be somewhat more
hesitant in committing to big-ticket purchases. Sales continued to be supported by the consistent availability of
credit from CAF and from third-party financing providers. Despite the deceleration in automotive industry sales,
our data indicated that we continued to gain share within our existing markets in fiscal 2008 in the late-model used
vehicle market.
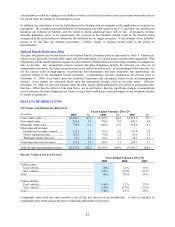
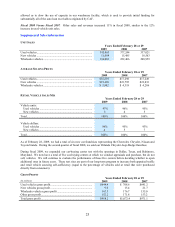
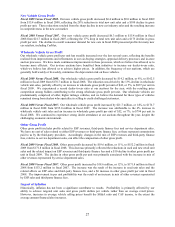
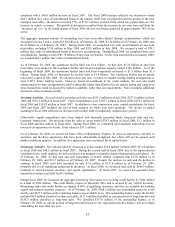
New Vehicle Sales
Fiscal 2009 Versus Fiscal 2008. New vehicle revenues declined 29% in fiscal 2009. The decline was the result of
a 28% decrease in unit sales and a 1% decrease in average selling price. New vehicle unit sales primarily reflected
the extremely soft new car industry sales trends, as well as the sale of our Orlando Chrysler-Jeep-Dodge franchise in
the second quarter of fiscal 2008. For the fiscal year ended February 28, 2009, new car manufacturers reported a
23% decline in U.S. new car unit sales.
Fiscal 2008 Versus Fiscal 2007. The 17% decrease in new vehicle revenues in fiscal 2008 was the result of a
corresponding decrease in unit sales. The decline in new vehicle unit sales reflected soft new car industry sales
trends, particularly for the domestic manufacturers that we represent, and the sale of our Orlando Chrysler-Jeep-
Dodge franchise.
Wholesale Vehicle Sales
Our operating strategy is to build customer satisfaction by offering high-quality vehicles. Fewer than half of the
vehicles acquired from consumers through the appraisal purchase process meet our standards for reconditioning and
subsequent retail sale. Those vehicles that do not meet our standards are sold through on-site wholesale auctions.
Our wholesale auction prices usually reflect the trends in the general wholesale market for the types of vehicles we
sell, although they could also be affected by changes in vehicle mix or the average age, mileage or condition of the
vehicles wholesaled.
Fiscal 2009 Versus Fiscal 2008. The 21% decrease in wholesale vehicle revenues in fiscal 2009 resulted from a
13% decrease in wholesale unit sales combined with a 10% decrease in average wholesale selling price. The decline
in unit sales primarily reflected a decrease in our appraisal traffic and, to a lesser extent, a decline in our appraisal
buy rate. Industry wholesale prices for SUVs, trucks and other less fuel efficient vehicles fell sharply in the first two
quarters of fiscal 2009, and prices for virtually all vehicle classes declined at an unprecedented rate during the third
quarter, reflecting the weak demand environment. We believe the significant drop in wholesale market values,
which resulted in corresponding decreases in our appraisal offers, contributed to the reduction in our buy rate.
Appraisal traffic was affected by the overall slowdown in customer traffic. The decline in average wholesale selling
price reflected the trends in the general wholesale market for the types of vehicles we sell.
Fiscal 2008 Versus Fiscal 2007. The 7% increase in wholesale vehicle revenues in fiscal 2008 resulted from a 6%
increase in wholesale unit sales combined with a 1% increase in average wholesale selling price. Our wholesale unit
sales benefited from an increase in appraisal traffic driven by the combination of the expansion of our store base and
our comparable store unit sales growth. However, our appraisal buy rate declined from the prior year level,
reflecting, we believe, an increasing hesitancy of consumers to commit to purchasing big-ticket items.
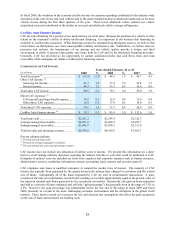
Other Sales and Revenues
Other sales and revenues include commissions on the sale of ESPs, service department sales and net third-party
finance fees. The fixed fees paid by third-party finance providers vary by provider, reflecting their differing levels
of credit risk exposure. Providers who purchase the highest risk loans purchase these loans at a discount, which is
reflected as an offset to finance fee revenues received from the other third-party providers.
Fiscal 2009 Versus Fiscal 2008. Other sales and revenues decreased 5% in fiscal 2009. ESP revenues declined
5%. Compared with the 8% decrease in total used vehicle unit sales in fiscal 2009, ESP revenues benefited from a
slow down in the rate of ESP cancellations, which we believe was the result of the decline in auto industry sales and
trade-ins. Third-party finance fees decreased 42% due to a combination of factors including the reduction in retail
vehicle unit sales, a shift in mix among providers and a change in discount arrangements with certain of the
providers during fiscal 2009. Collectively, the third-party providers financed a larger percentage of our retail unit
sales in the second half of fiscal 2009, as we chose to route more credit applications to these providers. Doing so