CarMax 2009 Annual Report Download - page 58
Download and view the complete annual report
Please find page 58 of the 2009 CarMax annual report below. You can navigate through the pages in the report by either clicking on the pages listed below, or by using the keyword search tool below to find specific information within the annual report.-
 1
1 -
2
-
3
-
4
-
5
-
6
-
7
-
8
-
9
-
10
-
11
-
12
-
13
-
14
-
15
-
16
-
17
-
18
-
19
-
20
-
21
-
22
-
23
-
24
-
25
-
26
-
27
-
28
-
29
-
30
-
31
-
32
-
33
-
34
-
35
-
36
-
37
-
38
-
39
-
40
-
41
-
42
-
43
-
44
-
45
-
46
-
47
-
 48
48 -
 49
49 -
 50
50 -
 51
51 -
 52
52 -
 53
53 -
 54
54 -
 55
55 -
 56
56 -
 57
57 -
 58
58 -
 59
59 -
 60
60 -
 61
61 -
 62
62 -
 63
63 -
 64
64 -
 65
65 -
 66
66 -
 67
67 -
 68
68 -
69
-
70
-
71
-
72
-
73
-
74
-
75
-
76
-
77
-
78
-
79
-
80
-
81
-
82
-
83
-
84
-
85
-
86
-
87
-
88
 |
 |

52
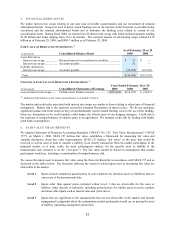
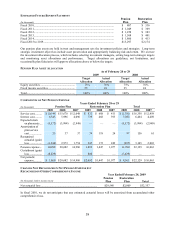
5. FINANCIAL DERIVATIVES
We utilize interest rate swaps relating to our auto loan receivable securitizations and our investment in retained
subordinated bonds. Swaps are used to better match funding costs to the interest on the fixed-rate receivables being
securitized and the retained subordinated bonds and to minimize the funding costs related to certain of our
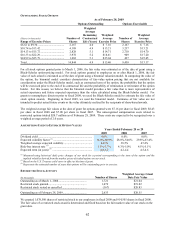
securitization trusts. During fiscal 2009, we entered into 84 interest rate swaps with initial notional amounts totaling
$1.88 billion and terms ranging from 16 to 46 months. The notional amount of outstanding swaps totaled $1.36
billion as of February 28, 2009, and $898.7 million as of February 29, 2008.
FAIR VALUE OF DERIVATIVE INSTRUMENTS (1)
As of February 28 or 29
(In thousands) Consolidated Balance Sheets 2009 2008
Asset derivatives
Interest rate swaps.................. Retained interest in securitized receivables................. $ 33 $ —
Interest rate swaps.................. Accounts payable ........................................................ 52 —
Liability derivatives
Interest rate swaps.................. Accounts payable ........................................................ (30,590) (15,130)
Total................................................................................................................................ $ (30,505) $ (15,130)
CHANGES IN FAIR VALUE OF DERIVATIVE INSTRUMENTS (1)
Years Ended February 28 or 29
(In thousands) Consolidated Statements of Earnings 2009 2008 2007
Loss on interest rate swaps ........ CarMax Auto Finance income ............... $ (15,214) $ (14,107) $ (2,627)
(1) Additional information on fair value measurements is included in Note 6.
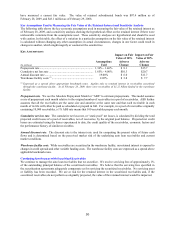
The market and credit risks associated with interest rate swaps are similar to those relating to other types of financial
instruments. Market risk is the exposure created by potential fluctuations in interest rates. We do not anticipate
significant market risk from swaps as they are predominantly used to match funding costs to the use of the funding.
However, disruptions in the credit markets could impact the effectiveness of our hedging strategies. Credit risk is
the exposure to nonperformance of another party to an agreement. We mitigate credit risk by dealing with highly
rated bank counterparties.
6. FAIR VALUE MEASUREMENTS
We adopted Statement of Financial Accounting Standards (“SFAS”) No. 157, “Fair Value Measurements” ("SFAS
157"), on March 1, 2008. SFAS 157 defines fair value, establishes a framework for measuring fair value and
expands disclosures about fair value measurements. SFAS 157 defines “fair value” as the price that would be
received to sell an asset or paid to transfer a liability in an orderly transaction between market participants in the
principal market, or if none exists, the most advantageous market, for the specific asset or liability at the
measurement date (referred to as the “exit price”). The fair value should be based on assumptions that market
participants would use, including a consideration of nonperformance risk.
We assess the inputs used to measure fair value using the three-tier hierarchy in accordance with SFAS 157 and as
disclosed in the tables below. The hierarchy indicates the extent to which inputs used in measuring fair value are
observable in the market.
Level 1 Inputs include unadjusted quoted prices in active markets for identical assets or liabilities that we
can access at the measurement date.
Level 2 Inputs other than quoted prices included within Level 1 that are observable for the asset or
liability, either directly or indirectly, including quoted prices for similar assets in active markets
and observable inputs such as interest rates and yield curves.
Level 3 Inputs that are significant to the measurement that are not observable in the market and include
management's judgments about the assumptions market participants would use in pricing the asset
or liability (including assumptions about risk).