CarMax 2009 Annual Report Download - page 33
Download and view the complete annual report
Please find page 33 of the 2009 CarMax annual report below. You can navigate through the pages in the report by either clicking on the pages listed below, or by using the keyword search tool below to find specific information within the annual report.-
 1
1 -
2
-
3
-
4
-
5
-
6
-
7
-
8
-
9
-
10
-
11
-
12
-
13
-
14
-
15
-
16
-
17
-
18
-
19
-
20
-
21
-
22
-
 23
23 -
 24
24 -
 25
25 -
 26
26 -
 27
27 -
 28
28 -
 29
29 -
 30
30 -
 31
31 -
 32
32 -
 33
33 -
 34
34 -
 35
35 -
 36
36 -
 37
37 -
 38
38 -
 39
39 -
 40
40 -
 41
41 -
 42
42 -
 43
43 -
44
-
45
-
46
-
47
-
48
-
49
-
50
-
51
-
52
-
53
-
54
-
55
-
56
-
57
-
58
-
59
-
60
-
61
-
62
-
63
-
64
-
65
-
66
-
67
-
68
-
69
-
70
-
71
-
72
-
73
-
74
-
75
-
76
-
77
-
78
-
79
-
80
-
81
-
82
-
83
-
84
-
85
-
86
-
87
-
88
 |
 |
27
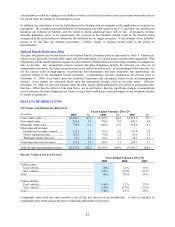
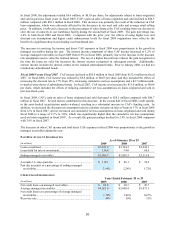
New Vehicle Gross Profit
Fiscal 2009 Versus Fiscal 2008. Our new vehicle gross profit decreased $6.4 million to $9.0 million in fiscal 2009
from $15.4 million in fiscal 2008, reflecting the 28% reduction in total new unit sales and a $180 decline in gross
profit per unit. These reductions resulted from the sharp decline in new car industry sales and the resulting increase
in competitiveness in the new car market.
Fiscal 2008 Versus Fiscal 2007. Our new vehicle gross profit decreased $6.3 million to $15.4 million in fiscal
2008 from $21.7 million in fiscal 2007, reflecting the 17% drop in total new unit sales and a $175 decline in gross
profit per unit. The decline in overall consumer demand for new cars in fiscal 2008 pressured profits for many new
car retailers, including CarMax.
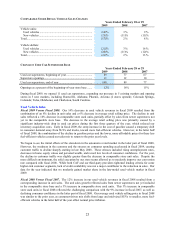
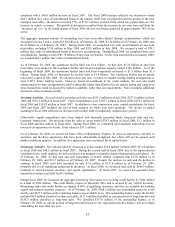
Wholesale Vehicle Gross Profit
Our wholesale vehicle gross profit per unit has steadily increased over the last several years, reflecting the benefits
realized from improvements and refinements in our car-buying strategies, appraisal delivery processes and in-store
auction processes. We have made continuous improvements in these processes, which we believe has allowed us to
become more efficient. Our in-store auctions have benefited from initiatives to increase our dealer-to-car ratio,
which we believe has allowed us to achieve higher prices. In addition, the frequency of our auctions, which are
generally held weekly or bi-weekly, minimizes the depreciation risk on these vehicles.
Fiscal 2009 Versus Fiscal 2008. Our wholesale vehicle gross profit decreased by $14.2 million, or 8%, to $162.5
million in fiscal 2009 from $176.7 million in fiscal 2008. The reduction was driven by the 13% decline in wholesale
vehicle unit sales, partially offset by an increase in wholesale gross profit per unit of $43, or 5%, to $837 per unit in
fiscal 2009. We experienced a record dealer-to-car ratio at our auctions for the year, with the resulting price
competition among bidders contributing to the strong wholesale gross profit per unit. Our wholesale vehicles are
predominantly comprised of older, higher mileage vehicles, and we believe the demand for these types of vehicles
remained strong from dealers who specialize in selling to credit-challenged customers.
Fiscal 2008 Versus Fiscal 2007. Our wholesale vehicle gross profit increased by $21.7 million, or 14%, to $176.7
million in fiscal 2008 from $155.0 million in fiscal 2007. The increase was attributable to the 6% increase in
wholesale vehicle unit sales and an increase in wholesale gross profit per unit of $52, or 7%, to $794 per unit in
fiscal 2008. We continued to experience strong dealer attendance at our auctions throughout the year, despite the
challenging economic environment.
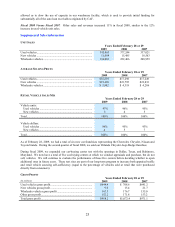
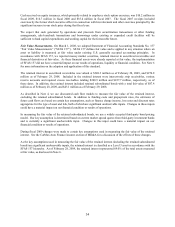
Other Gross Profit
Other gross profit includes profits related to ESP revenues, third-party finance fees and service department sales.
We have no cost of sales related to either ESP revenues or third-party finance fees, as these represent commissions
paid to us by the third-party providers. Accordingly, changes in the mix of ESP revenues and third-party finance
fees, relative to service department sales, can affect the composition of other gross profit.
Fiscal 2009 Versus Fiscal 2008. Other gross profit decreased by $19.6 million, or 11%, to $152.2 million in fiscal
2009 from $171.8 million in fiscal 2008. This decrease primarily reflected the reductions in used and new retail unit
sales and the related impact on ESP revenues and third-party finance fees and a $10 decline in other gross profit per
unit in fiscal 2009. The decline in other gross profit per unit was primarily associated with the increase in mix of
other revenues represented by service department sales.
Fiscal 2008 Versus Fiscal 2007. Other gross profit increased by $18.6 million, or 12%, to $171.8 million in fiscal
2008 from $153.2 million in fiscal 2007. The increase was the result of the increase in used unit sales and the
related affects on ESP sales and third-party finance fees, and a $6 increase in other gross profit per unit in fiscal
2008. The improvement in per unit profitability was the result of an increase in mix of other revenues represented
by ESP sales and third-party finance fees.
Impact of Inflation
Historically, inflation has not been a significant contributor to results. Profitability is primarily affected by our
ability to achieve targeted unit sales and gross profit dollars per vehicle rather than on average retail prices.
However, increases in average vehicle selling prices benefit the SG&A ratio and CAF income, to the extent the
average amount financed also increases.