Blackberry 2009 Annual Report Download - page 88
Download and view the complete annual report
Please find page 88 of the 2009 Blackberry annual report below. You can navigate through the pages in the report by either clicking on the pages listed below, or by using the keyword search tool below to find specific information within the annual report.-
 1
1 -
2
-
3
-
4
-
5
-
6
-
7
-
8
-
9
-
10
-
11
-
12
-
13
-
14
-
15
-
16
-
17
-
18
-
19
-
20
-
21
-
22
-
23
-
24
-
25
-
26
-
27
-
28
-
29
-
30
-
31
-
32
-
33
-
34
-
35
-
36
-
37
-
38
-
39
-
40
-
41
-
42
-
43
-
44
-
45
-
46
-
47
-
48
-
49
-
50
-
51
-
52
-
53
-
54
-
55
-
56
-
57
-
58
-
59
-
60
-
61
-
62
-
63
-
64
-
65
-
66
-
67
-
68
-
69
-
70
-
71
-
72
-
73
-
74
-
75
-
76
-
77
-
 78
78 -
 79
79 -
 80
80 -
 81
81 -
 82
82 -
 83
83 -
 84
84 -
 85
85 -
 86
86 -
 87
87 -
 88
88 -
 89
89 -
 90
90 -
 91
91 -
 92
92
 |
 |

86
RESEARCH IN MOTION LIMITED
notes to the consolidated financial statements continued
In thousands of United States dollars, except share and per share data, and except as otherwise indicated
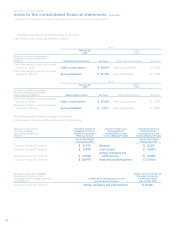
18. SEGMENT DISCLOSURES
The Company is organized and managed as a single
reportable business segment. The Company’s operations are
substantially all related to the research, design, manufacture
and sales of wireless communications products, services and
software.
Selected financial information is as follows:
For the year ended
February 28,
2009 March 1,
2008 March 3,
2007
Revenue
Canada $ 887,005 $ 438,302 $ 222,517
United States 6,967,598 3,528,858 1,756,608
United Kingdom 711,536 461,592 267,353
Other 2,499,047 1,580,643 790,625
$ 11,065,186 $ 6,009,395 $ 3,037,103
Revenue
Canada 8.0% 7.3% 7.3%
United States 63.0% 58.7% 57.9%
United Kingdom 6.4% 7.7% 8.8%
Other 22.6% 26.3% 26.0%
100.0% 100.0% 100.0%
For the year ended
February 28,
2009 March 1,
2008 March 3,
2007
Revenue mix
Devices $ 9,089,736 $ 4,768,610 $ 2,215,951
Service 1,402,560 860,641 560,116
Software 251,871 234,388 173,187
Other 321,019 145,756 87,849
$ 11,065,186 $ 6,009,395 $ 3,037,103
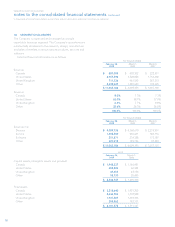
As at
February 28,
2009 March 1,
2008
Capital assets, intangible assets and goodwill
Canada $ 1,948,337 $ 1,166,451
United States 482,826 60,354
United Kingdom 49,454 43,150
Other 58,130 20,443
$ 2,538,747 $ 1,290,398
Total assets
Canada $ 3,218,640 $ 1,921,202
United States 2,646,783 1,738,508
United Kingdom 1,931,387 1,669,366
Other 304,562 182,111
$ 8,101,372 $ 5,511,187