Blackberry 2009 Annual Report Download - page 11
Download and view the complete annual report
Please find page 11 of the 2009 Blackberry annual report below. You can navigate through the pages in the report by either clicking on the pages listed below, or by using the keyword search tool below to find specific information within the annual report.-
 1
1 -
 2
2 -
 3
3 -
 4
4 -
 5
5 -
 6
6 -
 7
7 -
 8
8 -
 9
9 -
 10
10 -
 11
11 -
 12
12 -
 13
13 -
 14
14 -
 15
15 -
 16
16 -
 17
17 -
 18
18 -
 19
19 -
 20
20 -
 21
21 -
 22
22 -
23
-
24
-
25
-
26
-
27
-
28
-
29
-
30
-
31
-
32
-
33
-
34
-
35
-
36
-
37
-
38
-
39
-
40
-
41
-
42
-
43
-
44
-
45
-
46
-
47
-
48
-
49
-
50
-
51
-
52
-
53
-
54
-
55
-
56
-
57
-
58
-
59
-
60
-
61
-
62
-
63
-
64
-
65
-
66
-
67
-
68
-
69
-
70
-
71
-
72
-
73
-
74
-
75
-
76
-
77
-
78
-
79
-
80
-
81
-
82
-
83
-
84
-
85
-
86
-
87
-
88
-
89
-
90
-
91
-
92
 |
 |

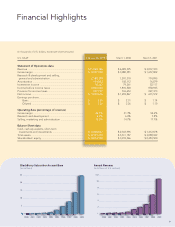
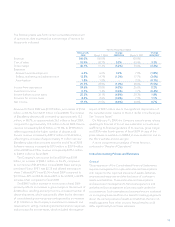
Financial Highlights
Annual Revenue
(in billions of U.S. dollars)
BlackBerry Subscriber Account Base
(in millions)
9
(in thousands of U.S. dollars, except per share amounts)
U.S. GAAP February 28, 2009 March 1, 2008 March 3, 2007
Statement of Operations data
Revenue ................................................................................... $ 11,065,186 $ 6,009,395 $ 3,037,103
Gross margin ........................................................................... $ 5,097,298 $ 3,080,581 $ 1,657,802
Research & development and selling,
general and administration ..................................................
2,180,399 1,241,310 774,095
Amortization ............................................................................ 194,803 108,112 76,879
Investment income ................................................................. 78,267 79,361 52,117
Income before income taxes ................................................. 2,800,363 1,810,520 858,945
Provision for income taxes ..................................................... 907,747 516,653 227,373
Net income .............................................................................. $ 1,892,616 $ 1,293,867 $ 631,572
Earningspershare ...................................................................
Basic ................................................................................. $ 3.35 $ 2.31 $ 1.14
Diluted ............................................................................. $ 3.30 $ 2.26 $ 1.10
Operating data (percentage of revenue)
Gross margin ........................................................................... 46.1% 51.3% 54.6%
Research and development ................................................... 6.2% 6.0% 7.8%
Selling, marketing and administration .................................. 13.5% 14.7% 17.7%
Balance Sheet data
Cash, cash equivalents, short-term
investments and investments .............................................. $ 2,238,847 $ 2,343,996 $ 1,412,878
Total assets .............................................................................. $ 8,101,372 $ 5,511,187 $ 3,088,949
Shareholders’ equity ............................................................... $ 5,874,128 $ 3,933,566 $ 2,483,500
0
2
4
6
8
10
$12
0
0
0
5
10
15
20
25
0
2009200820072006200520042003200220012000 2009200820072006200520042003200220012000