Blackberry 2009 Annual Report Download - page 35
Download and view the complete annual report
Please find page 35 of the 2009 Blackberry annual report below. You can navigate through the pages in the report by either clicking on the pages listed below, or by using the keyword search tool below to find specific information within the annual report.-
 1
1 -
2
-
3
-
4
-
5
-
6
-
7
-
8
-
9
-
10
-
11
-
12
-
13
-
14
-
15
-
16
-
17
-
18
-
19
-
20
-
21
-
22
-
23
-
24
-
 25
25 -
 26
26 -
 27
27 -
 28
28 -
 29
29 -
 30
30 -
 31
31 -
 32
32 -
 33
33 -
 34
34 -
 35
35 -
 36
36 -
 37
37 -
 38
38 -
 39
39 -
 40
40 -
 41
41 -
 42
42 -
 43
43 -
 44
44 -
 45
45 -
46
-
47
-
48
-
49
-
50
-
51
-
52
-
53
-
54
-
55
-
56
-
57
-
58
-
59
-
60
-
61
-
62
-
63
-
64
-
65
-
66
-
67
-
68
-
69
-
70
-
71
-
72
-
73
-
74
-
75
-
76
-
77
-
78
-
79
-
80
-
81
-
82
-
83
-
84
-
85
-
86
-
87
-
88
-
89
-
90
-
91
-
92
 |
 |

33
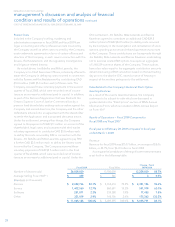
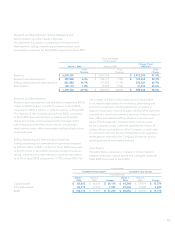
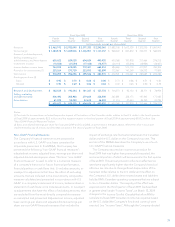
Research and Development, Selling, Marketing and
Administration, and Amortization Expense
The table below presents a comparison of research and
development, selling, marketing and administration, and
amortization expenses for fiscal 2008 compared to fiscal 2007.
Fiscal Year Ended
(in thousands)
March 1, 2008 March 3, 2007 Change - Fiscal
2008/2007
% of
Revenue % of
Revenue % of
Change
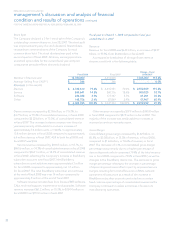
Revenue $ 6,009,395 $ 3,037,103 $ 2,972,292 97.9%
Research and development $ 359,828 6.0% $ 236,173 7.8% $ 123,655 52.4%
Selling, marketing and administration 881,482 14.7% 537,922 17.7% 343,560 63.9%
Amortization 108,112 1.8% 76,879 2.5% 31,233 40.6%
$ 1,349,422 22.5% $ 850,974 28.0% $ 498,448 58.6%
Research and Development
Research and development expenditures increased by $123.6
million to $359.8 million, or 6.0% of revenue, in fiscal 2008,
compared to $236.2 million, or 7.8% of revenue, in fiscal 2007.
The majority of the increases during fiscal 2008, compared
to fiscal 2007, were attributable to salaries and benefits
due to an increase in the average headcount associated
with research and development activities, new product
development costs, office and related staffing infrastructure
costs and travel.
Selling, Marketing and Administration Expenses
Selling, marketing and administration expenses increased
by $343.6 million to $881.5 million for fiscal 2008 compared
to $537.9 million in fiscal 2007. As a percentage of revenue,
selling, marketing and administration expenses decreased
to 14.7% in fiscal 2008 compared to 17.7% in fiscal 2007. The
net increase of $343.6 million was primarily attributable
to increased expenditures for marketing, advertising and
promotion expenses including additional programs to
support new product launches, salary and benefits expenses
primarily as a result of increased personnel, external advisory
fees, office and related staffing infrastructure costs and
travel. The increase also included other costs incurred
by the Company under indemnity agreements in favor of
certain officers and directors of the Company, in each case
in connection with the Review, the Restatement, regulatory
investigations relating to the Company’s historical option
granting practices and related matters.
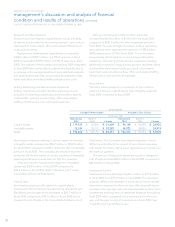
Amortization
The table below presents a comparison of amortization
expense relating to capital assets and intangible assets for
fiscal 2008 compared to fiscal 2007.
(in thousands)
Included in Amortization Included in Cost of sales
Fiscal year end
March 1,
2008 March 3,
2007 Change March 1,
2008 March 3,
2007 Change
Capital assets $ 87,800 $ 63,624 $ 24,176 $ 45,248 $ 29,874 $ 15,374
Intangible assets 20,312 13,255 7,057 24,006 19,602 4,404
Total $ 108,112 $ 76,879 $ 31,233 $ 69,254 $ 49,476 $ 19,778