Blackberry 2009 Annual Report Download - page 51
Download and view the complete annual report
Please find page 51 of the 2009 Blackberry annual report below. You can navigate through the pages in the report by either clicking on the pages listed below, or by using the keyword search tool below to find specific information within the annual report.-
 1
1 -
2
-
3
-
4
-
5
-
6
-
7
-
8
-
9
-
10
-
11
-
12
-
13
-
14
-
15
-
16
-
17
-
18
-
19
-
20
-
21
-
22
-
23
-
24
-
25
-
26
-
27
-
28
-
29
-
30
-
31
-
32
-
33
-
34
-
35
-
36
-
37
-
38
-
39
-
40
-
 41
41 -
 42
42 -
 43
43 -
 44
44 -
 45
45 -
 46
46 -
 47
47 -
 48
48 -
 49
49 -
 50
50 -
 51
51 -
 52
52 -
 53
53 -
 54
54 -
 55
55 -
 56
56 -
 57
57 -
 58
58 -
 59
59 -
 60
60 -
 61
61 -
62
-
63
-
64
-
65
-
66
-
67
-
68
-
69
-
70
-
71
-
72
-
73
-
74
-
75
-
76
-
77
-
78
-
79
-
80
-
81
-
82
-
83
-
84
-
85
-
86
-
87
-
88
-
89
-
90
-
91
-
92
 |
 |

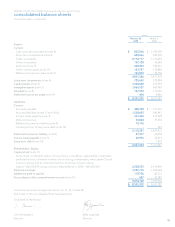
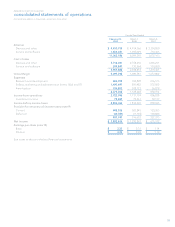
49
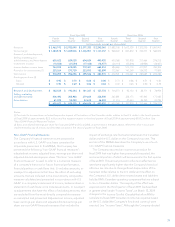
As at
February 28,
2009 March 1,
2008
Assets
Current
Cash and cash equivalents (note 4) $ 835,546 $ 1,184,398
Short-term investments (note 4) 682,666 420,709
Trade receivables 2,112,117 1,174,692
Other receivables 157,728 74,689
Inventory (note 5) 682,400 396,267
Other current assets (note 17) 187,257 135,849
Deferred income tax asset (note 9) 183,872 90,750
4,841,586 3,477,354
Long-term investments (note 4) 720,635 738,889
Capital assets (note 6) 1,334,648 705,955
Intangible assets (note 7) 1,066,527 469,988
Goodwill (note 8) 137,572 114,455
Deferred income tax asset (note 9) 404 4,546
$ 8,101,372 $ 5,511,187
Liabilities
Current
Accounts payable $ 448,339 $ 271,076
Accrued liabilities (notes 13 and 16(c)) 1,238,602 690,442
Income taxes payable (note 9) 361,460 475,328
Deferred revenue 53,834 37,236
Deferred income tax liability (note 9) 13,116 -
Current portion of long-term debt (note 10) -349
2,115,351 1,474,431
Deferred income tax liability (note 9) 87,917 65,058
Income taxes payable (note 9) 23,976 30,873
Long-term debt (note 10) -7,259
2,227,244 1,577,621
Shareholders’ Equity
Capital stock (note 11)
Authorized - unlimited number of non-voting, cumulative, redeemable, retractable
preferred shares; unlimited number of non-voting, redeemable, retractable Class A
common shares and an unlimited number of voting common shares
Issued - 566,218,819 voting common shares (March 1, 2008 - 562,652,461) 2,208,235 2,169,856
Retained earnings 3,545,710 1,653,094
Additional paid-in capital 119,726 80,333
Accumulated other comprehensive income (note 15) 457 30,283
5,874,128 3,933,566
$ 8,101,372 $ 5,511,187
Commitments and contingencies (notes 10, 12, 13, 17 and 19)
See notes to the consolidated financial statements.
On behalf of the Board:
John Richardson Mike Lazaridis
Director Director
RESEARCH IN MOTION LIMITED Incorporated under the Laws of Ontario
consolidated balance sheets
(United States dollars, in thousands)