Blackberry 2009 Annual Report Download - page 39
Download and view the complete annual report
Please find page 39 of the 2009 Blackberry annual report below. You can navigate through the pages in the report by either clicking on the pages listed below, or by using the keyword search tool below to find specific information within the annual report.-
 1
1 -
2
-
3
-
4
-
5
-
6
-
7
-
8
-
9
-
10
-
11
-
12
-
13
-
14
-
15
-
16
-
17
-
18
-
19
-
20
-
21
-
22
-
23
-
24
-
25
-
26
-
27
-
28
-
 29
29 -
 30
30 -
 31
31 -
 32
32 -
 33
33 -
 34
34 -
 35
35 -
 36
36 -
 37
37 -
 38
38 -
 39
39 -
 40
40 -
 41
41 -
 42
42 -
 43
43 -
 44
44 -
 45
45 -
 46
46 -
 47
47 -
 48
48 -
 49
49 -
50
-
51
-
52
-
53
-
54
-
55
-
56
-
57
-
58
-
59
-
60
-
61
-
62
-
63
-
64
-
65
-
66
-
67
-
68
-
69
-
70
-
71
-
72
-
73
-
74
-
75
-
76
-
77
-
78
-
79
-
80
-
81
-
82
-
83
-
84
-
85
-
86
-
87
-
88
-
89
-
90
-
91
-
92
 |
 |

37
RIM’s network operations infrastructure as a result of the
increase in BlackBerry subscriber accounts. The Company
expects consolidated gross margins to be approximately
43-44% in the first quarter of fiscal 2010, based on the
Company’s current expectation for product mix, device ASP,
current product costs and foreign exchange. Based on the
Company’s current view and the potential for variation due
to these factors, the Company expects consolidated gross
margin percentage for fiscal year 2010 to be in the low forties.
Research and Development, Selling, Marketing and
Administration, and Amortization Expense
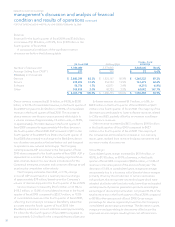
The table below presents a comparison of research and
development, selling, marketing and administration,
and amortization expenses for the quarter ended
February 28, 2009 compared to the quarter ended
November 29, 2008 and the quarter ended March 1, 2008.
The Company believes it is meaningful to provide a
comparison between the fourth quarter of fiscal 2009 and the
third quarter of fiscal 2009 given the quarterly increases in
revenue realized by the Company during fiscal 2009.
Three Month Fiscal Periods Ended
(in thousands)
February 28, 2009 November 29, 2008 March 1, 2008
% of
Revenue % of
Revenue % of
Revenue
Revenue $ 3,463,193 $ 2,782,098 $ 1,882,705
Research and development $ 182,535 5.3% $ 193,044 6.9% $ 104,573 5.6%
Selling, marketing and administration 406,493 11.7% 382,968 13.8% 267,881 14.2%
Amortization 61,595 1.8% 53,023 1.9% 31,314 1.7%
$ 650,623 18.8% $ 629,035 22.6% $ 403,768 21.4%
Total research and development, selling, marketing and
administration, and amortization expenses for the fourth
quarter as a percentage of revenue decreased by 3.8% to
18.8% of revenues when compared to the third quarter of
fiscal 2009.
Research and Development
Research and development expenditures increased by
$77.9 million to $182.5 million, or 5.3% of revenue, in the
fourth quarter of fiscal 2009, compared to $104.6 million,
or 5.6% of revenue, in the fourth quarter of fiscal 2008. The
majority of the increases during the fourth quarter of fiscal
2009 compared to the fourth quarter of fiscal 2008 were
attributable to salaries and benefits due to an increase
in the average headcount associated with research and
development activities, new product development costs and
office and related staffing infrastructure costs.
Selling, Marketing and Administration Expenses
Selling, marketing and administration expenses increased by
$138.6 million to $406.5 million for the fourth quarter of fiscal
2009 compared to $267.9 million for the comparable period in
fiscal 2008. As a percentage of revenue, selling, marketing and
administration expenses decreased to 11.7% in the fourth quarter
of fiscal 2009 compared to 14.2% in the fourth quarter of fiscal
2008. The net increase was primarily attributable to increased
expenditures for marketing, advertising and promotion expenses
including additional programs to support new product launches,
salary and benefits expenses primarily as a result of increased
personnel and office and related staffing infrastructure costs.
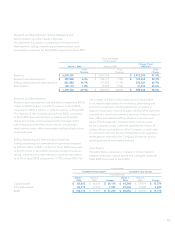
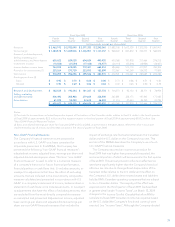
Amortization
The table below presents a comparison of amortization
expense relating to capital assets and intangible assets
for the quarter ended February 28, 2009 compared to the
quarter ended March 1, 2008.
(in thousands)
Included in Amortization Included in Cost of sales
Three Month Fiscal Period Ended
February 28,
2009 March 1,
2008 Change February 28,
2009 March 1,
2008 Change
Capital assets $ 36,662 $ 24,662 $ 12,000 $ 28,347 $ 12,824 $ 15,523
Intangible assets 24,933 6,652 18,281 26,183 6,374 19,809
Total $ 61,595 $ 31,314 $ 30,281 $ 54,530 $ 19,198 $ 35,332