Blackberry 2009 Annual Report Download - page 32
Download and view the complete annual report
Please find page 32 of the 2009 Blackberry annual report below. You can navigate through the pages in the report by either clicking on the pages listed below, or by using the keyword search tool below to find specific information within the annual report.-
 1
1 -
2
-
3
-
4
-
5
-
6
-
7
-
8
-
9
-
10
-
11
-
12
-
13
-
14
-
15
-
16
-
17
-
18
-
19
-
20
-
21
-
 22
22 -
 23
23 -
 24
24 -
 25
25 -
 26
26 -
 27
27 -
 28
28 -
 29
29 -
 30
30 -
 31
31 -
 32
32 -
 33
33 -
 34
34 -
 35
35 -
 36
36 -
 37
37 -
 38
38 -
 39
39 -
 40
40 -
 41
41 -
 42
42 -
43
-
44
-
45
-
46
-
47
-
48
-
49
-
50
-
51
-
52
-
53
-
54
-
55
-
56
-
57
-
58
-
59
-
60
-
61
-
62
-
63
-
64
-
65
-
66
-
67
-
68
-
69
-
70
-
71
-
72
-
73
-
74
-
75
-
76
-
77
-
78
-
79
-
80
-
81
-
82
-
83
-
84
-
85
-
86
-
87
-
88
-
89
-
90
-
91
-
92
 |
 |

RESEARCH IN MOTION LIMITED
management’s discussion and analysis of financial
condition and results of operations continued
FOR THE THREE MONTHS AND FISCAL YEAR ENDED FEBRUARY 28, 2009
30
Research and Development
Research and development expenditures consist primarily
of salaries and benefits for technical personnel, new product
development costs, travel, office and related infrastructure
costs and recruiting.
Research and development expenditures increased by
$324.9 million to $684.7 million, or 6.2% of revenue, in fiscal
2009, compared to $359.8 million, or 6.0% of revenue, in fiscal
2008. The majority of the increases during fiscal 2009 compared
to fiscal 2008 were attributable to salaries and benefits due to
an increase in the average headcount associated with research
and development activities, new product development costs,
travel and office and related staffing infrastructure costs.
Selling, Marketing and Administration Expenses
Selling, marketing and administration expenses consist
primarily of marketing, advertising and promotion, salaries
and benefits, external advisory fees, office and related
staffing infrastructure costs and travel expenses.
Selling, marketing and administration expenses
increased by $614.2 million to $1.50 billion for fiscal 2009
compared to $881.5 million for the comparable period in
fiscal 2008. As a percentage of revenue, selling, marketing
and administration expenses decreased to 13.5% in fiscal
2009 compared to 14.7% in fiscal 2008. The net increase
was primarily attributable to increased expenditures for
marketing, advertising and promotion expenses including
additional programs to support new product launches, salary
and benefits expenses primarily as a result of increased
personnel, external advisory fees, office and related staffing
infrastructure costs and travel expenses.
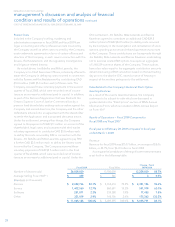
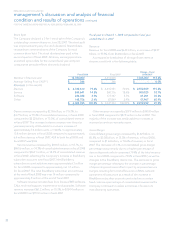
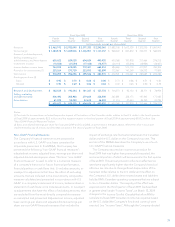
Amortization
The table below presents a comparison of amortization
expense relating to capital assets and intangible assets for
fiscal 2009 compared to fiscal 2008.
(in thousands)
Included in Amortization Included in Cost of sales
Fiscal year end
February 28,
2009 March 1,
2008 Change February 28,
2009 March 1,
2008 Change
Capital assets $ 119,209 $ 87,800 $ 31,409 $ 84,168 $ 45,248 $ 38,920
Intangible assets 75,594 20,312 $ 55,282 48,925 24,006 24,919
Total $ 194,803 $ 108,112 $ 86,691 $ 133,093 $ 69,254 $ 63,839
Amortization expense relating to certain capital and certain
intangible assets increased by $86.7 million to $194.8 million
for fiscal 2009 compared to $108.1 million for the comparable
period in fiscal 2008. The increased amortization expense
primarily reflects the impact of certain capital and intangible
asset expenditures incurred over the last four quarters.
Total amortization expense with respect to intangible
assets was $124.5 million in fiscal 2009 compared to
$44.3 million in fiscal 2008. Refer to Notes 6 and 7 to the
Consolidated Financial Statements.
Cost of sales
Amortization expense with respect to capital assets
employed in the Company’s manufacturing operations and
BlackBerry service operations increased to $84.2 million in
fiscal 2009 compared to $45.2 million in fiscal 2008 and is
charged to cost of sales in the Consolidated Statements of
Operations. The increased amortization expense in fiscal
2009 primarily reflects the impact of amortization expense
with respect to these capital asset expenditures incurred over
the last four quarters.
The amount of intangible assets amortization charged to
cost of sales and was $48.9 million in fiscal 2009 compared to
$24.0 million in fiscal 2008.
Investment Income
Investment income decreased by $1.1 million to $78.3 million
in fiscal 2009 from $79.4 million in fiscal 2008. The decrease
primarily reflects the decrease in yields due to lower interest
rates when compared to the prior year, offset partially by an
increase in the average cash and cash equivalents, short-term
investments and long-term investments balances throughout
fiscal 2009 when compared to the same period in the prior
year and the gain on sale of investments in fiscal 2009. See
“Liquidity and Capital Resources”.