Blackberry 2009 Annual Report Download - page 41
Download and view the complete annual report
Please find page 41 of the 2009 Blackberry annual report below. You can navigate through the pages in the report by either clicking on the pages listed below, or by using the keyword search tool below to find specific information within the annual report.
39
Fiscal Year 2009 Fiscal Year 2008
Fourth
Quarter Third
Quarter Second
Quarter First
Quarter Fourth
Quarter Third
Quarter Second
Quarter First
Quarter
(in thousands, except per share data)
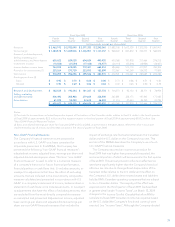
Revenue $ 3,463,193 $ 2,782,098 $ 2,577,330 $ 2,242,565 $ 1,882,705 $ 1,672,529 $ 1,372,250 $ 1,081,911
Gross margin $ 1,383,578 $ 1,269,506 $ 1,306,857 $ 1,137,357 $ 968,222 $ 847,872 $ 704,417 $ 560,070
Research and development,
Selling, marketing and
administration, and Amortization 650,623 629,035 604,624 490,920 403,768 357,978 311,464 276,212
Investment income (10,568) (31,554) (17,168) (18,977) (20,114) (23,816) (18,984) (16,447)
Income before income taxes 743,523 672,025 719,401 665,414 584,568 513,710 411,937 300,305
Provision for income taxes (1) 225,264 275,729 223,855 182,899 172,067 143,249 124,252 77,085
Net income $ 518,259 $ 396,296 $ 495,546 $ 482,515 $ 412,501 $ 370,461 $ 287,685 $ 223,220
Earnings per share (2)
Basic $ 0.92 $ 0.70 $ 0.88 $ 0.86 $ 0.73 $ 0.66 $ 0.51 $ 0.40
Diluted $ 0.90 $ 0.69 $ 0.86 $ 0.84 $ 0.72 $ 0.65 $ 0.50 $ 0.39
Research and development $ 182,535 $ 193,044 $ 181,347 $ 127,776 $ 104,573 $ 92,150 $ 88,171 $ 74,934
Selling, marketing
and administration 406,493 382,968 379,644 326,592 267,881 238,175 197,943 177,483
Amortization 61,595 53,023 43,633 36,552 31,314 27,653 25,350 23,795
$ 650,623 $ 629,035 $ 604,624 $ 490,920 $ 403,768 $ 357,978 $ 311,464 $ 276,212
Notes:
(1) Provision for income taxes includes the positive impact of fluctuations of the Canadian dollar relative to the U.S. dollar in the fourth quarter
of fiscal 2009 of approximately $3.5 million and the negative impact in the third quarter of fiscal 2009 of approximately $103.2 million. See
“Non-GAAP Financial Measures” below.
(2) Basic and diluted earnings per share for fiscal year 2009 and fiscal 2008, as presented in the table above, reflect the 3-for-1 stock split
implemented by way of a stock dividend that was paid in the second quarter of fiscal 2008.
Non-GAAP Financial Measures
The Company’s financial statements are prepared in
accordance with U.S. GAAP on a basis consistent for
all periods presented. In this MD&A, the Company has
presented the following “non-GAAP financial measures”:
adjusted net income, adjusted basic earnings per share and
adjusted diluted earnings per share. The term “non-GAAP
financial measure” is used to refer to a numerical measure
of a company’s historical or future financial performance,
financial position or cash flows that: (i) excludes amounts, or
is subject to adjustments that have the effect of excluding
amounts, that are included in the most directly comparable
measure calculated and presented in accordance with U.S.
GAAP in a company’s statement of income, balance sheet or
statement of cash flows; or (ii) includes amounts, or is subject
to adjustments that have the effect of including amounts, that
are excluded from the most directly comparable measure
so calculated and presented. Adjusted net income, adjusted
basic earnings per share and adjusted diluted earnings per
share are non-GAAP financial measures that exclude the
impact of exchange rate fluctuations between the Canadian
dollar and the U.S. dollar on the Company’s tax rate. This
section of the MD&A describes the Company’s use of such
non-GAAP financial measures.
The Company reported an income tax provision for
fiscal 2009 that was higher than previously forecasted, the
incremental portion of which will be reversed in the first quarter
of fiscal 2010. This annual provision reflects an effective tax
rate that is significantly higher than the Company’s historical
effective tax rate due to the significant depreciation of the
Canadian dollar relative to the U.S. dollar and its effect on
the Company’s U.S. dollar denominated assets and liabilities
held by RIM’s Canadian operating companies that are subject
to tax in Canadian dollars. The majority of this effect was
experienced in the third quarter of fiscal 2009. As described
in greater detail under “Income Taxes”, on March 12, 2009
changes to the Income Tax Act (Canada) that allow RIM to
calculate its fiscal 2009 Canadian income tax expense based
on the U.S. dollar (the Company’s functional currency) were
enacted. See “Income Taxes”. Although the Company elected


