Blackberry 2009 Annual Report Download - page 36
Download and view the complete annual report
Please find page 36 of the 2009 Blackberry annual report below. You can navigate through the pages in the report by either clicking on the pages listed below, or by using the keyword search tool below to find specific information within the annual report.-
 1
1 -
2
-
3
-
4
-
5
-
6
-
7
-
8
-
9
-
10
-
11
-
12
-
13
-
14
-
15
-
16
-
17
-
18
-
19
-
20
-
21
-
22
-
23
-
24
-
25
-
 26
26 -
 27
27 -
 28
28 -
 29
29 -
 30
30 -
 31
31 -
 32
32 -
 33
33 -
 34
34 -
 35
35 -
 36
36 -
 37
37 -
 38
38 -
 39
39 -
 40
40 -
 41
41 -
 42
42 -
 43
43 -
 44
44 -
 45
45 -
 46
46 -
47
-
48
-
49
-
50
-
51
-
52
-
53
-
54
-
55
-
56
-
57
-
58
-
59
-
60
-
61
-
62
-
63
-
64
-
65
-
66
-
67
-
68
-
69
-
70
-
71
-
72
-
73
-
74
-
75
-
76
-
77
-
78
-
79
-
80
-
81
-
82
-
83
-
84
-
85
-
86
-
87
-
88
-
89
-
90
-
91
-
92
 |
 |
RESEARCH IN MOTION LIMITED
management’s discussion and analysis of financial
condition and results of operations continued
FOR THE THREE MONTHS AND FISCAL YEAR ENDED FEBRUARY 28, 2009
34
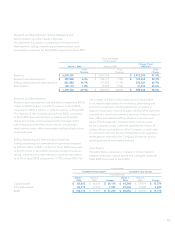
Amortization expense relating to certain capital and certain
intangible assets increased by $31.2 million to $108.1 million
for fiscal 2008 compared to $76.9 million for the comparable
period in fiscal 2007. The increased amortization expense
primarily reflects the impact of a full year amortization of
fiscal 2007 additions plus a partial year’s amortization for
fiscal 2008 additions.
Total amortization expense with respect to intangible
assets was $44.3 million in fiscal 2008 compared to $32.9
million in fiscal 2007.
Cost of sales
Amortization expense with respect to capital assets
employed in the Company’s manufacturing operations and
BlackBerry service operations increased to $45.2 million in
fiscal 2008 compared to $29.9 million in fiscal 2007 and is
charged to cost of sales in the Consolidated Statements of
Operations. The increased amortization expense in fiscal
2008 reflects the impact of a full year’s amortization expense
with respect to these capital asset expenditures incurred
during fiscal 2007 and also incremental amortization with
respect to capital asset expenditures incurred during fiscal
2008.
The amount of intangible assets amortization charged to
cost of sales was $24.0 million in fiscal 2008 compared to $19.6
million in fiscal 2007.
Investment Income
Investment income increased by $27.3 million to $79.4 million
in fiscal 2008 from $52.1 million in fiscal 2007. The increase
primarily reflects the increase in cash and cash equivalents,
short-term investments and long-term investments when
compared to the prior year.
Income Taxes
For fiscal 2008, the Company’s income tax expense was
$516.7 million, resulting in an effective tax rate of 28.5%
compared to income tax expense of $227.4 million or an
effective tax rate of 26.5% for fiscal 2007. The Company’s
effective tax rate reflects the geographic mix of earnings in
jurisdictions with different tax rates. The fiscal 2008 effective
tax rate increase was partially offset by the significant
depreciation of the U.S. dollar relative to the Canadian
dollar during fiscal 2008, the impact of enacted Canadian
federal income tax rate reductions in the fourth quarter of
fiscal 2008 on the Company’s deferred income tax asset and
liability balances, and the settlement in the third quarter
of fiscal 2008 of previously unrecognized ITCs on research
and development expenditures attributable to prior fiscal
periods. The foreign exchange impact was a result of the U.S.
denominated assets and liabilities, and the related timing of
these transactions, held by Canadian entities that are subject
to tax in Canadian dollars.
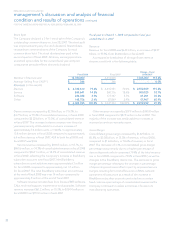
Net Income
Net income was $1.29 billion, or $2.31 basic EPS and $2.26
diluted EPS, in fiscal 2008 compared to net income of $631.6
million, or $1.14 basic EPS and $1.10 diluted EPS, in fiscal 2007.
The $662.3 million increase in net income in fiscal 2008
reflects primarily an increase in gross margin in the amount of
$1.42 billion, which was offset in part by an increase of $756.5
million in the Company’s research and development, selling,
marketing and administration expenses and the Company’s
provision for income taxes.
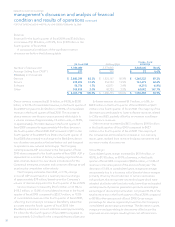
The weighted average number of shares outstanding was
559.8 million common shares for basic EPS and 572.8 million
common shares for diluted EPS for year ended March 1, 2008
compared to 556.1 million common shares for basic EPS and
571.8 million common shares for diluted EPS for the same
period in fiscal 2007. Both the weighted average number of
shares outstanding and the basic and diluted EPS for year
ended March 1, 2008 and year ended March 3, 2007 reflects
the 3-for-1 stock split implemented by way of a stock dividend
that was paid in the second quarter of fiscal 2008.