Blackberry 2009 Annual Report Download - page 42
Download and view the complete annual report
Please find page 42 of the 2009 Blackberry annual report below. You can navigate through the pages in the report by either clicking on the pages listed below, or by using the keyword search tool below to find specific information within the annual report.-
 1
1 -
2
-
3
-
4
-
5
-
6
-
7
-
8
-
9
-
10
-
11
-
12
-
13
-
14
-
15
-
16
-
17
-
18
-
19
-
20
-
21
-
22
-
23
-
24
-
25
-
26
-
27
-
28
-
29
-
30
-
31
-
 32
32 -
 33
33 -
 34
34 -
 35
35 -
 36
36 -
 37
37 -
 38
38 -
 39
39 -
 40
40 -
 41
41 -
 42
42 -
 43
43 -
 44
44 -
 45
45 -
 46
46 -
 47
47 -
 48
48 -
 49
49 -
 50
50 -
 51
51 -
 52
52 -
53
-
54
-
55
-
56
-
57
-
58
-
59
-
60
-
61
-
62
-
63
-
64
-
65
-
66
-
67
-
68
-
69
-
70
-
71
-
72
-
73
-
74
-
75
-
76
-
77
-
78
-
79
-
80
-
81
-
82
-
83
-
84
-
85
-
86
-
87
-
88
-
89
-
90
-
91
-
92
 |
 |

RESEARCH IN MOTION LIMITED
management’s discussion and analysis of financial
condition and results of operations continued
FOR THE THREE MONTHS AND FISCAL YEAR ENDED FEBRUARY 28, 2009
40
for Canadian income tax purposes to adopt these rules in the
third quarter of fiscal 2009, the Company cannot recognize the
related income tax reduction of electing to adopt these rules
for U.S. GAAP financial reporting purposes until the quarter in
which they are enacted, resulting in a higher provision for the
fourth quarter of fiscal 2009. In the first quarter of fiscal 2010,
the Company will record an incremental, one time net benefit
of approximately $70 - $100 million to net income relating
to the enactment of the rules. As result of the enactment of
the rules, future volatility in the Company’s effective tax rate
should be reduced. Since the incremental tax expense in
fiscal 2009 will be reversed and additional net benefits from
adoption will be realized because the rules were enacted, the
Company believes presenting non-GAAP financial measures
that exclude the impact of exchange rate fluctuations between
the Canadian dollar and the U.S. dollar enables the Company,
and its shareholders, to better assess the Company’s operating
performance relative to its financial results in prior periods and
improves the comparability of the information presented.
The Company’s income tax provision for the fourth quarter
of fiscal 2009 was not significantly impacted by changes in the
Canadian dollar as outlined in the table below.
Investors are cautioned that adjusted net income and
adjusted earnings per share do not have any standardized
meaning prescribed by GAAP and are therefore unlikely
to be comparable to similarly titled measures reported by
other issuers. These non-GAAP financial measures should be
considered in the context of the Company’s U.S. GAAP results.
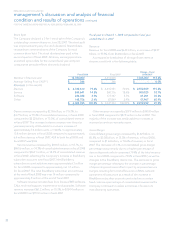
The following table provides a reconciliation of net income
to adjusted net income, basic earnings per share to adjusted
basic earnings per share and diluted earnings per share to
adjusted diluted earnings per share.
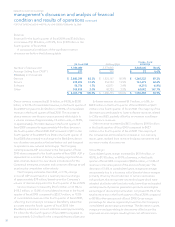
(in thousands, except per share amounts)
Three months
ended
February 28, 2009 Fiscal year ended
February 28, 2009
Net income $ 518,259 $ 1,892,616
Impact using functional currency (U.S. dollar) to determine
Canadian income taxes (1) (3,500) 99,700
Adjusted net income (1) 514,759 1,992,316
Basic earnings per share 0.92 3.35
Diluted earnings per share 0.90 3.30
Adjusted basic earnings per share (1) 0.91 3.53
Adjusted diluted earnings per share (1) 0.90 3.47
(1) These are non-GAAP amounts or non-GAAP financial measures
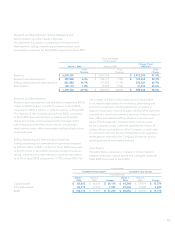
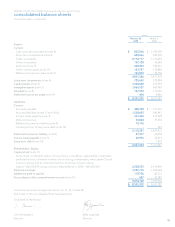
Financial Condition
Liquidity and Capital Resources
Cash and cash equivalents, short-term investments and long-
term investments decreased by $105.1 million to $2.24 billion
as at February 28, 2009 from $2.34 billion as at March 1, 2008.
The majority of the Company’s cash and cash equivalents,
short-term investments and long-term investments are
denominated in U.S. dollars as at February 28, 2009.
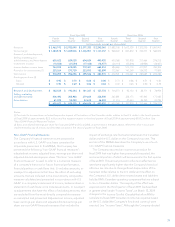
A comparative summary of cash and cash equivalents, short-
term investments and long-term investments is set out below.
As at
(in thousands)
February 28, 2009 March 1, 2008 Change - Fiscal
2009/2008
Cash and cash equivalents $ 835,546 $ 1,184,398 $ (348,852)
Short-term investments 682,666 420,709 261,957
Long-term investments 720,635 738,889 (18,254)
Cash and cash equivalents, short-term investments and long-term investments $ 2,238,847 $ 2,343,996 $ (105,149)