Blackberry 2009 Annual Report Download - page 52
Download and view the complete annual report
Please find page 52 of the 2009 Blackberry annual report below. You can navigate through the pages in the report by either clicking on the pages listed below, or by using the keyword search tool below to find specific information within the annual report.-
 1
1 -
2
-
3
-
4
-
5
-
6
-
7
-
8
-
9
-
10
-
11
-
12
-
13
-
14
-
15
-
16
-
17
-
18
-
19
-
20
-
21
-
22
-
23
-
24
-
25
-
26
-
27
-
28
-
29
-
30
-
31
-
32
-
33
-
34
-
35
-
36
-
37
-
38
-
39
-
40
-
41
-
 42
42 -
 43
43 -
 44
44 -
 45
45 -
 46
46 -
 47
47 -
 48
48 -
 49
49 -
 50
50 -
 51
51 -
 52
52 -
 53
53 -
 54
54 -
 55
55 -
 56
56 -
 57
57 -
 58
58 -
 59
59 -
 60
60 -
 61
61 -
 62
62 -
63
-
64
-
65
-
66
-
67
-
68
-
69
-
70
-
71
-
72
-
73
-
74
-
75
-
76
-
77
-
78
-
79
-
80
-
81
-
82
-
83
-
84
-
85
-
86
-
87
-
88
-
89
-
90
-
91
-
92
 |
 |

50
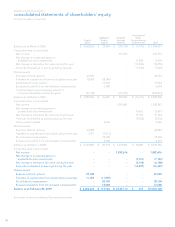
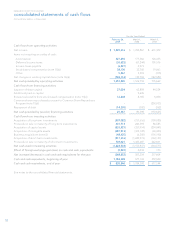
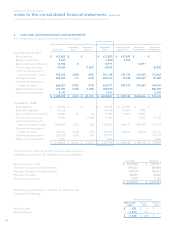
RESEARCH IN MOTION LIMITED
consolidated statements of shareholders’ equity
(United States dollars, in thousands)
Capital
Stock
Additional
Paid-In
Capital
Retained
Earnings
(Deficit)
Accumulated
Other
Comprehensive
Income (Loss) Total
Balance as at March 4, 2006 $ 2,068,869 $ 28,694 $ (100,174) $ (1,974) $ 1,995,415
Comprehensive income (loss):
Net income - - 631,572 - 631,572
Net change in unrealized gains on
available-for-sale investments - - - 11,839 11,839
Net change in derivative fair value during the year - - - (13,455) (13,455)
Amounts reclassified to earnings during the year - - - (7,926) (7,926)
Shares issued:
Exercise of stock options 44,534 - - - 44,534
Transfers to capital stock from stock option exercises 18,055 (18,055) - - -
Stock-based compensation - 19,454 - - 19,454
Excess tax benefits from stock-based compensation - 6,000 - - 6,000
Common shares repurchased pursuant to
Common Share Repurchase Program (31,762) - (172,171) - (203,933)
Balance as at March 3, 2007 $ 2,099,696 $ 36,093 $ 359,227 $ (11,516) $ 2,483,500
Comprehensive income (loss):
Net income - - 1,293,867 - 1,293,867
Net change in unrealized gains on
available-for-sale investments - - - 13,467 13,467
Net change in derivative fair value during the year - - - 37,564 37,564
Amounts reclassified to earnings during the year - - - (9,232) (9,232)
Other paid-in capital - 9,626 - - 9,626
Shares issued:
Exercise of stock options 62,889 - - - 62,889
Transfers to capital stock from stock option exercises 7,271 (7,271) - - -
Stock-based compensation - 33,700 - - 33,700
Excess tax benefits from stock-based compensation - 8,185 - - 8,185
Balance as at March 1, 2008 $ 2,169,856 $ 80,333 $ 1,653,094 $ 30,283 $ 3,933,566
Comprehensive income (loss):
Net income - - 1,892,616 - 1,892,616
Net change in unrealized gains on
available-for-sale investments - - - (7,161) (7,161)
Net change in derivative fair value during the year - - - (6,168) (6,168)
Amounts reclassified to earnings during the year - - - (16,497) (16,497)
Shares issued:
Exercise of stock options 27,024 - - - 27,024
Transfers to capital stock from stock option exercises 11,355 (11,355) - - -
Stock-based compensation - 38,100 - - 38,100
Excess tax benefits from stock-based compensation - 12,648 - - 12,648
Balance as at February 28, 2009 $ 2,208,235 $ 119,726 $ 3,545,710 $ 457 $ 5,874,128
See notes to the consolidated financial statements.