Blackberry 2009 Annual Report Download - page 20
Download and view the complete annual report
Please find page 20 of the 2009 Blackberry annual report below. You can navigate through the pages in the report by either clicking on the pages listed below, or by using the keyword search tool below to find specific information within the annual report.-
 1
1 -
2
-
3
-
4
-
5
-
6
-
7
-
8
-
9
-
 10
10 -
 11
11 -
 12
12 -
 13
13 -
 14
14 -
 15
15 -
 16
16 -
 17
17 -
 18
18 -
 19
19 -
 20
20 -
 21
21 -
 22
22 -
 23
23 -
 24
24 -
 25
25 -
 26
26 -
 27
27 -
 28
28 -
 29
29 -
 30
30 -
31
-
32
-
33
-
34
-
35
-
36
-
37
-
38
-
39
-
40
-
41
-
42
-
43
-
44
-
45
-
46
-
47
-
48
-
49
-
50
-
51
-
52
-
53
-
54
-
55
-
56
-
57
-
58
-
59
-
60
-
61
-
62
-
63
-
64
-
65
-
66
-
67
-
68
-
69
-
70
-
71
-
72
-
73
-
74
-
75
-
76
-
77
-
78
-
79
-
80
-
81
-
82
-
83
-
84
-
85
-
86
-
87
-
88
-
89
-
90
-
91
-
92
 |
 |

RESEARCH IN MOTION LIMITED
management’s discussion and analysis of financial
condition and results of operations continued
FOR THE THREE MONTHS AND FISCAL YEAR ENDED FEBRUARY 28, 2009
18
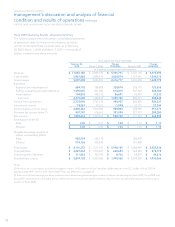
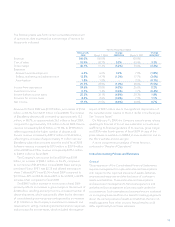
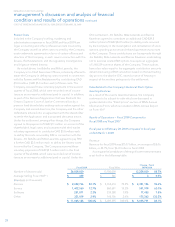
Fiscal 2009 Operating Results – Executive Summary
The following table sets forth certain consolidated statement
of operations data, for the periods indicated, as well as
certain consolidated balance sheet data, as at February
28, 2009, March 1, 2008 and March 3, 2007 in thousands of
dollars, except for per share amounts.
As at and for the Fiscal Year Ended
February 28,
2009 March 1, 2008 Change
2009/2008 March 3, 2007 Change
2008/2007
(in thousands, except for per share amounts)
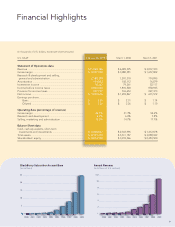
Revenue $ 11,065,186 $ 6,009,395 $ 5,055,791 $ 3,037,103 $ 2,972,292
Cost of sales 5,967,888 2,928,814 3,039,074 1,379,301 1,549,513
Gross margin 5,097,298 3,080,581 2,016,717 1,657,802 1,422,779
Expenses
Research and development 684,702 359,828 324,874 236,173 123,655
Selling, marketing and administration 1,495,697 881,482 614,215 537,922 343,560
Amortization 194,803 108,112 86,691 76,879 31,233
Sub-total 2,375,202 1,349,422 1,025,780 850,974 498,448
Income from operations 2,722,096 1,731,159 990,937 806,828 924,331
Investment income 78,267 79,361 (1,094)52,117 27,244
Income before income taxes 2,800,363 1,810,520 989,843 858,945 951,575
Provision for income taxes (1) 907,747 516,653 391,094 227,373 289,280
Net income $ 1,892,616 $ 1,293,867 $ 598,749 $ 631,572 $ 662,295
Earnings per share (2)
Basic $ 3.35 $ 2.31 $ 1.04 $ 1.14 $ 1.17
Diluted $ 3.30 $ 2.26 $ 1.04 $ 1.10 $ 1.16
Weighted-average number of
shares outstanding (000’s)
Basic 565,059 559,778 556,059
Diluted 574,156 572,830 571,809
Total assets $ 8,101,372 $ 5,511,187 $ 2,590,185 $ 3,088,949 $ 2,422,238
Total liabilities $ 2,227,244 $ 1,577,621 $ 649,623 $ 605,449 $ 972,172
Total long-term liabilities $ 111,893 $ 103,190 $ 8,703 $ 58,874 $ 44,316
Shareholders’ equity $ 5,874,128 $ 3,933,566 $ 1,940,562 $ 2,483,500 $ 1,450,066
Notes:
(1) Provision for income taxes includes the negative impact of fluctuations of the Canadian dollar relative to the U.S. dollar in fiscal 2009 of
approximately $99.7 million. See “Non-GAAP Financial Measures” on page 39.
(2) Basic and diluted earnings per share and basic and diluted weighted-average number of shares outstanding for fiscal 2009, fiscal 2008 and
fiscal 2007, as presented in the table above, reflect the 3-for-1 stock split implemented by way of a stock dividend that was paid in the second
quarter of fiscal 2008.