Blackberry 2009 Annual Report Download - page 40
Download and view the complete annual report
Please find page 40 of the 2009 Blackberry annual report below. You can navigate through the pages in the report by either clicking on the pages listed below, or by using the keyword search tool below to find specific information within the annual report.-
 1
1 -
2
-
3
-
4
-
5
-
6
-
7
-
8
-
9
-
10
-
11
-
12
-
13
-
14
-
15
-
16
-
17
-
18
-
19
-
20
-
21
-
22
-
23
-
24
-
25
-
26
-
27
-
28
-
29
-
 30
30 -
 31
31 -
 32
32 -
 33
33 -
 34
34 -
 35
35 -
 36
36 -
 37
37 -
 38
38 -
 39
39 -
 40
40 -
 41
41 -
 42
42 -
 43
43 -
 44
44 -
 45
45 -
 46
46 -
 47
47 -
 48
48 -
 49
49 -
 50
50 -
51
-
52
-
53
-
54
-
55
-
56
-
57
-
58
-
59
-
60
-
61
-
62
-
63
-
64
-
65
-
66
-
67
-
68
-
69
-
70
-
71
-
72
-
73
-
74
-
75
-
76
-
77
-
78
-
79
-
80
-
81
-
82
-
83
-
84
-
85
-
86
-
87
-
88
-
89
-
90
-
91
-
92
 |
 |
RESEARCH IN MOTION LIMITED
management’s discussion and analysis of financial
condition and results of operations continued
FOR THE THREE MONTHS AND FISCAL YEAR ENDED FEBRUARY 28, 2009
38
Amortization expense relating to certain capital and certain
intangible assets licenses increased by $30.3 million to $61.6
million for the fourth quarter of fiscal 2009 compared to
$31.3 million for the comparable period in fiscal 2008. The
increased amortization expense primarily reflects the impact
of certain capital and intangible asset expenditures incurred
over the last four quarters.
Total amortization expense with respect to intangible assets
was $51.1 million in the fourth quarter of fiscal 2009 compared
to $13.0 million in the fourth quarter of fiscal 2008. Refer to
Notes 6 and 7 to the Consolidated Financial Statements.
Cost of sales
Amortization expense with respect to capital assets
employed in the Company’s manufacturing operations and
BlackBerry service operations increased to $28.3 million in the
fourth quarter of fiscal 2009 compared to $12.8 million in the
fourth quarter of fiscal 2008 and is charged to cost of sales in
the Consolidated Statements of Operations. The increased
amortization expense in the fourth quarter of fiscal 2009
primarily reflects the impact of amortization expense with
respect to these capital asset expenditures incurred over the
last four quarters.
The amount of intangible assets amortization charged to
cost of sales and was $26.2 million in the fourth quarter of
fiscal 2009 compared to $6.4 million in the fourth quarter of
fiscal 2008.
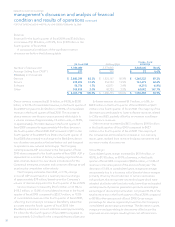
Investment Income
Investment income decreased by $9.5 million to $10.6 million
in the fourth quarter of fiscal 2009 from $20.1 million in the
fourth quarter of fiscal 2008. The decrease primarily reflects a
decrease in yields due to lower interest rates when compared
to the prior year. See “Liquidity and Capital Resources”.
Income Taxes
For the fourth quarter of fiscal 2009, the Company’s income
tax expense was $225.3 million, resulting in an effective tax
rate of 30.3% compared to income tax expense of $172.1
million and an effective tax rate of 29.4% for the same period
last year. The Company’s effective tax rate reflects the
geographic mix of earnings in jurisdictions with different tax
rates. The Company’s effective tax rate for the fourth quarter
of fiscal 2009 was not significantly impacted by the continued
variability in the value of the Canadian dollar relative to the
U.S. dollar. The Company’s adjusted tax rate for the fourth
quarter of fiscal 2009 was 30.8% which was approximately
1% higher than management’s estimate of 29%-30% for the
quarter. The higher than expected adjusted tax rate was
primarily a result of lower than expected ITCs. The lower
effective tax rate in the fourth quarter of fiscal 2008 was
primarily due to the favorable impact of the depreciation of
the U.S. dollar relative to the Canadian dollar.
Net Income
Net income was $518.3 million in the fourth quarter of fiscal
2009, compared to net income of $412.5 million in the fourth
quarter of fiscal 2008. Basic EPS was $0.92 and diluted EPS
was $0.90 in the fourth quarter of fiscal 2009 compared to
$0.73 basic EPS and $0.72 diluted EPS, in the fourth quarter of
fiscal 2008.
The $105.8 million increase in net income in the fourth
quarter of fiscal 2009 reflects primarily an increase in gross
margin in the amount of $415.4 million, resulting primarily from
the increased number of device shipments, which was offset in
part by the decrease of consolidated gross margin percentage
and by an increase of $269.8 million in the Company’s
investments in research and development, selling, marketing
and administration expenses and the Company’s provision
for income taxes which, included the positive impact of $3.5
million due to the marginal increase of the Canadian dollar
relative to the U.S. dollar in the quarter, see “Income Taxes”.
Adjusted net income was $514.8 million, adjusted basic
EPS was $0.91 and adjusted diluted EPS was $0.90 in the
fourth quarter of fiscal 2009. See “Non-GAAP Financial
Measures”.
The weighted average number of shares outstanding
was 566.1 million common shares for basic EPS and 572.8
million common shares for diluted EPS for the quarter ended
February 28, 2009 compared to 561.8 million common shares
for basic EPS and 573.9 million common shares for diluted EPS
for the same period last year.
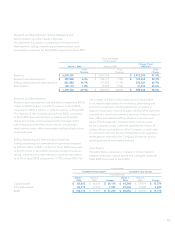
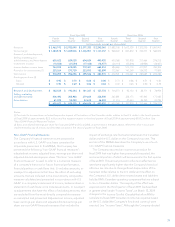
Selected Quarterly Financial Data
The following table sets forth RIM’s unaudited quarterly
consolidated results of operations data for each of the
eight most recent quarters, including the quarter ended
February 28, 2009. The information in the table below has
been derived from RIM’s unaudited interim consolidated
financial statements that, in management’s opinion, have
been prepared on a basis consistent with the Consolidated
Financial Statements of the Company and include all
adjustments necessary for a fair presentation of information
when read in conjunction with the Consolidated Financial
Statements of the Company. RIM’s quarterly operating
results have varied substantially in the past and may vary
substantially in the future. Accordingly, the information below
is not necessarily indicative of results for any future quarter.