Blackberry 2009 Annual Report Download - page 62
Download and view the complete annual report
Please find page 62 of the 2009 Blackberry annual report below. You can navigate through the pages in the report by either clicking on the pages listed below, or by using the keyword search tool below to find specific information within the annual report.-
 1
1 -
2
-
3
-
4
-
5
-
6
-
7
-
8
-
9
-
10
-
11
-
12
-
13
-
14
-
15
-
16
-
17
-
18
-
19
-
20
-
21
-
22
-
23
-
24
-
25
-
26
-
27
-
28
-
29
-
30
-
31
-
32
-
33
-
34
-
35
-
36
-
37
-
38
-
39
-
40
-
41
-
42
-
43
-
44
-
45
-
46
-
47
-
48
-
49
-
50
-
51
-
 52
52 -
 53
53 -
 54
54 -
 55
55 -
 56
56 -
 57
57 -
 58
58 -
 59
59 -
 60
60 -
 61
61 -
 62
62 -
 63
63 -
 64
64 -
 65
65 -
 66
66 -
 67
67 -
 68
68 -
 69
69 -
 70
70 -
 71
71 -
 72
72 -
73
-
74
-
75
-
76
-
77
-
78
-
79
-
80
-
81
-
82
-
83
-
84
-
85
-
86
-
87
-
88
-
89
-
90
-
91
-
92
 |
 |

60
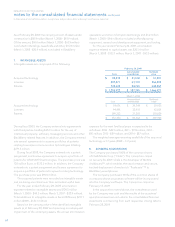
RESEARCH IN MOTION LIMITED
notes to the consolidated financial statements continued
In thousands of United States dollars, except share and per share data, and except as otherwise indicated
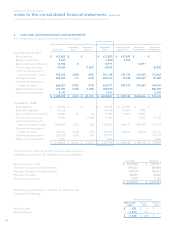
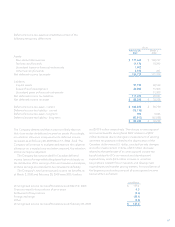
4. CASH AND CASH EQUIVALENTS AND INVESTMENTS
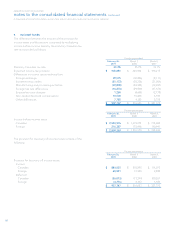
The components of cash and investments were as follows:
Cost Basis Unrealized
Gains Unrealized
Losses Recorded
Basis Cash and Cash
Equivalents Short-term
Investments Long-term
Investments
As at February 28, 2009
Bank balances $ 477,855 $ - $ - $ 477,855 $ 477,855 $ - $ -
Money market fund 5,000 - - 5,000 5,000 - -
Bank certificates of deposit 14,963 8 - 14,971 - 14,971 -
Auction-rate securities 40,529 - (7,687) 32,842 - 32,842
Commercial paper and
corporate notes / bonds 404,623 3,608 (443) 407,788 124,720 145,605 137,463
US treasury notes 245,050 717 (153) 245,614 19,398 205,633 20,583
Government sponsored
enterprise notes 666,627 2,922 (178) 669,371 208,573 316,457 144,341
Asset-backed securities 379,091 2,658 (1,540) 380,209 - - 380,209
Other cost investments 5,197 - - 5,197 - - 5,197
$ 2,238,935 $ 9,913 $ (10,001) $ 2,238,847 $ 835,546 $ 682,666 $ 720,635
As at March 1, 2008
Bank balances $ 125,904 $ - $ - $ 125,904 $ 125,904 $ - $ -
Bank term deposits 116,768 - - 116,768 114,909 1,859 -
Bank certificates of deposit 93,280 27 (2) 93,305 37,818 55,487 -
Auction-rate securities 55,067 - (3,230) 51,837 - 14,512 37,325
Commercial paper and
corporate notes / bonds 1,041,835 3,442 (54) 1,045,223 666,114 255,975 123,134
Government sponsored
enterprise notes 606,879 3,468 (67) 610,280 239,653 92,876 277,751
Asset-backed securities 291,689 3,504 (14) 295,179 - - 295,179
Other cost investments 5,500 - - 5,500 - - 5,500
$ 2,336,922 $ 10,441 $ (3,367) $ 2,343,996 $ 1,184,398 $ 420,709 $ 738,889
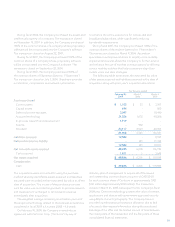
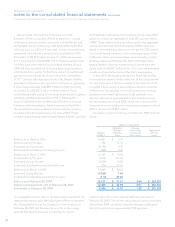
The contractual maturities of cash and cash equivalents and
investments at February 28, 2009 were recorded as follows:
Cost Basis Fair Value
Due in one year or less $ 1,516,825 $ 1,518,211
Due after one year through five years 550,447 556,084
Due after five years through ten years 125,937 126,513
Due after ten years 40,529 32,842
No fixed maturity date 5,197 5,197
$ 2,238,935 $ 2,238,847
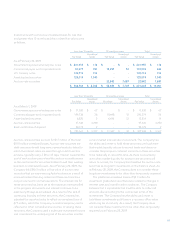
Realized gains and losses on available-for-sale securities
comprise the following:
For the year ended
February 28,
2009 March 1,
2008 March 3,
2007
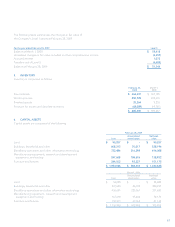
Realized gains $ 158 $ 10 $ -
Realized losses (1,801) (410) -
$ (1,643) $ (400) $ -