Blackberry 2009 Annual Report Download - page 38
Download and view the complete annual report
Please find page 38 of the 2009 Blackberry annual report below. You can navigate through the pages in the report by either clicking on the pages listed below, or by using the keyword search tool below to find specific information within the annual report.-
 1
1 -
2
-
3
-
4
-
5
-
6
-
7
-
8
-
9
-
10
-
11
-
12
-
13
-
14
-
15
-
16
-
17
-
18
-
19
-
20
-
21
-
22
-
23
-
24
-
25
-
26
-
27
-
 28
28 -
 29
29 -
 30
30 -
 31
31 -
 32
32 -
 33
33 -
 34
34 -
 35
35 -
 36
36 -
 37
37 -
 38
38 -
 39
39 -
 40
40 -
 41
41 -
 42
42 -
 43
43 -
 44
44 -
 45
45 -
 46
46 -
 47
47 -
 48
48 -
49
-
50
-
51
-
52
-
53
-
54
-
55
-
56
-
57
-
58
-
59
-
60
-
61
-
62
-
63
-
64
-
65
-
66
-
67
-
68
-
69
-
70
-
71
-
72
-
73
-
74
-
75
-
76
-
77
-
78
-
79
-
80
-
81
-
82
-
83
-
84
-
85
-
86
-
87
-
88
-
89
-
90
-
91
-
92
 |
 |

RESEARCH IN MOTION LIMITED
management’s discussion and analysis of financial
condition and results of operations continued
FOR THE THREE MONTHS AND FISCAL YEAR ENDED FEBRUARY 28, 2009
36
Software revenue decreased $4.3 million, or 6.8%, to
$58.8 million in the fourth quarter of fiscal 2009 from $63.1
million in the fourth quarter of fiscal 2008. The majority of the
decrease was attributable to lower software revenues related
to CALs and BES, partially offset by an increase in software
maintenance revenues.
Other revenue increased by $63.1 million to $105.8 million
in the fourth quarter of fiscal 2009 compared to $42.7
million in the fourth quarter of fiscal 2008. The majority of
the increase was attributable to increases in non-warranty
repair, gains realized from revenue hedging instruments and
increase in sales of accessories.
Gross Margin
Consolidated gross margin increased by $415.4 million, or
42.9%, to $1.38 billion, or 40.0% of revenue, in the fourth
quarter of fiscal 2009, compared to $968.2 million, or 51.4% of
revenue, in the same period of the previous fiscal year. The
decrease of 11.4% in consolidated gross margin percentage
was primarily due to a decrease in the blended device margins
primarily driven by the introduction of certain new feature
rich products that incorporate new technologies which were
adopted at a faster rate than historically, lower than anticipated
unit shipments of previous generation products and a higher
percentage of device shipments which comprised 83.3% of the
total revenue mix in the fourth quarter of fiscal 2009 compared
to 80.9% in the same period of fiscal 2008. Gross margin
percentage for devices is generally lower than the Company’s
consolidated gross margin percentage. The decrease in gross
margin percentage relating to devices was offset in part by
improved service margins resulting from cost efficiencies in
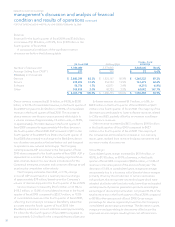
Revenue
Revenue for the fourth quarter of fiscal 2009 was $3.46 billion,
an increase of $1.58 billion, or 83.9%, from $1.88 billion in the
fourth quarter of fiscal 2008.
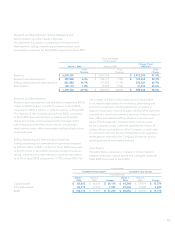
A comparative breakdown of the significant revenue
streams is set forth in the following table:
Q4 Fiscal 2009 Q4 Fiscal 2008 Change - Fiscal
2009/2008
Number of devices sold 7,780,000 4,372,000 3,408,000 78.0%
Average Selling Price (“ASP”) $ 371 $ 348 $ 23 6.6%
Revenues (in thousands)
Devices $ 2,883,399 83.3% $ 1,523,167 80.9% $ 1,360,232 89.3%
Service 415,223 12.0% 253,744 13.5% 161,479 63.6%
Software 58,756 1.7% 63,071 3.4% (4,315) (6.8%)
Other 105,815 3.0% 42,723 2.2% 63,092 147.7%
$ 3,463,193 100.0% $ 1,882,705 100.0% $ 1,580,488 83.9%
Device revenue increased by $1.36 billion, or 89.3%, to $2.88
billion, or 83.3% of consolidated revenue, in the fourth quarter of
fiscal 2009 compared to $1.52 billion, or 80.9%, of consolidated
revenue in the fourth quarter of fiscal 2008. This increase in
device revenue over the prior year is primarily attributable to
a volume increase of approximately 3.4 million units, or 78.0%,
to approximately 7.8 million devices in the fourth quarter of
fiscal 2009 compared to approximately 4.4 million devices in
the fourth quarter of fiscal 2008. ASP increased to $371 in the
fourth quarter of fiscal 2009 from $348 in the fourth quarter of
fiscal 2008 due primarily to a change in the BlackBerry device
mix of certain new products that are feature rich and designed
to operate on new network technologies. The Company
currently expects ASP to be lower in the first quarter of fiscal
2010 when compared to the fourth quarter of fiscal 2009. ASP is
dependent on a number of factors, including projected future
sales volumes, device mix, new device introductions for the
Company’s enterprise, prosumer and consumer offerings as well
as pricing by competitors in the industry.
The Company estimates that a $10, or 2.7%, change
in overall ASP would result in a quarterly revenue change
of approximately $78 million, based upon the Company’s
volume of devices shipped in the fourth quarter of fiscal 2009.
Service revenue increased by $161.5 million, or 63.6%, to
$415.2 million, or 12.0% of consolidated revenue in the fourth
quarter of fiscal 2009 compared to $253.7 million, or 13.5%
of consolidated revenue in the fourth quarter of fiscal 2008,
reflecting the Company’s increase in BlackBerry subscriber
accounts since the fourth quarter of fiscal 2008. Net
BlackBerry subscriber account additions were approximately
3.9 million for the fourth quarter of fiscal 2009 compared to
approximately 2.2 million for the comparable period last year.