Blackberry 2009 Annual Report Download - page 37
Download and view the complete annual report
Please find page 37 of the 2009 Blackberry annual report below. You can navigate through the pages in the report by either clicking on the pages listed below, or by using the keyword search tool below to find specific information within the annual report.-
 1
1 -
2
-
3
-
4
-
5
-
6
-
7
-
8
-
9
-
10
-
11
-
12
-
13
-
14
-
15
-
16
-
17
-
18
-
19
-
20
-
21
-
22
-
23
-
24
-
25
-
26
-
 27
27 -
 28
28 -
 29
29 -
 30
30 -
 31
31 -
 32
32 -
 33
33 -
 34
34 -
 35
35 -
 36
36 -
 37
37 -
 38
38 -
 39
39 -
 40
40 -
 41
41 -
 42
42 -
 43
43 -
 44
44 -
 45
45 -
 46
46 -
 47
47 -
48
-
49
-
50
-
51
-
52
-
53
-
54
-
55
-
56
-
57
-
58
-
59
-
60
-
61
-
62
-
63
-
64
-
65
-
66
-
67
-
68
-
69
-
70
-
71
-
72
-
73
-
74
-
75
-
76
-
77
-
78
-
79
-
80
-
81
-
82
-
83
-
84
-
85
-
86
-
87
-
88
-
89
-
90
-
91
-
92
 |
 |

35
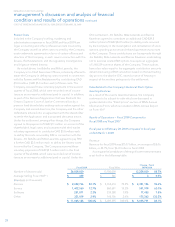
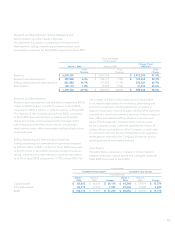
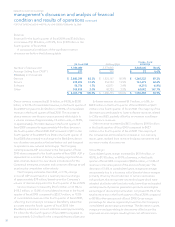
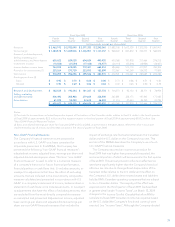
Summary Results of Operations
Three months ended February 28, 2009 compared to the
three months ended March 1, 2008
The following table sets forth certain unaudited interim
consolidated statement of operations data, which is
expressed in thousands of dollars and as a percentage of
revenue for the interim periods indicated.
For the Three Months Ended
February 28,
2009 March 1,
2008
Change
Q4 Fiscal
2009/2008
(in thousands, except for per share amounts)
Revenue $ 3,463,193 100.0% $ 1,882,705 100.0% $ 1,580,488
Cost of sales 2,079,615 60.0% 914,483 48.6% 1,165,132
Gross margin 1,383,578 40.0% 968,222 51.4% 415,356
Expenses
Research and development 182,535 5.3% 104,573 5.6% 77,962
Selling, marketing and administration 406,493 11.7% 267,881 14.2% 138,612
Amortization 61,595 1.8% 31,314 1.7% 30,281
650,623 18.8% 403,768 21.4% 246,855
Income from operations 732,955 21.2% 564,454 30.0% 168,501
Investment income 10,568 0.3% 20,114 1.1% (9,546)
Income before income taxes 743,523 21.5% 584,568 31.0% 158,955
Provision for income taxes (1) 225,264 6.5% 172,067 9.1% 53,197
Net income $ 518,259 15.0% $ 412,501 21.9% $ 105,758
Earnings per share
Basic $ 0.92 $ 0.73 $ 0.19
Diluted $ 0.90 $ 0.72 $ 0.18
Weighted-average number of shares
outstanding (000’s)
Basic 566,105 561,837
Diluted 572,753 573,851
Notes:
(1) Provision for income taxes includes the positive impact of fluctuations of the Canadian dollar relative to the U.S. dollar in the fourth quarter
of fiscal 2009 of approximately $3.5 million. See “Non-GAAP Financial Measures” on page 39.