Berkshire Hathaway 1998 Annual Report Download - page 52
Download and view the complete annual report
Please find page 52 of the 1998 Berkshire Hathaway annual report below. You can navigate through the pages in the report by either clicking on the pages listed below, or by using the keyword search tool below to find specific information within the annual report.-
 1
1 -
2
-
3
-
4
-
5
-
6
-
7
-
8
-
9
-
10
-
11
-
12
-
13
-
14
-
15
-
16
-
17
-
18
-
19
-
20
-
21
-
22
-
23
-
24
-
25
-
26
-
27
-
28
-
29
-
30
-
31
-
32
-
33
-
34
-
35
-
36
-
37
-
38
-
39
-
40
-
41
-
 42
42 -
 43
43 -
 44
44 -
 45
45 -
 46
46 -
 47
47 -
 48
48 -
 49
49 -
 50
50 -
 51
51 -
 52
52 -
 53
53 -
 54
54 -
 55
55 -
 56
56 -
 57
57 -
 58
58 -
 59
59 -
 60
60 -
 61
61 -
 62
62 -
63
-
64
-
65
-
66
-
67
-
68
-
69
-
70
-
71
-
72
-
73
-
74
 |
 |

51
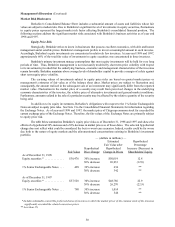
Management's Discussion (Continued)
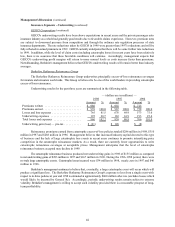
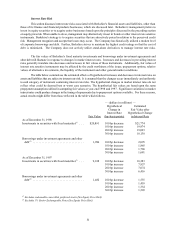
Interest Rate Risk
This section discusses interest rate risks associated with Berkshire’s financial assets and liabilities, other than
those of its finance and financial products businesses, which are discussed later. Berkshire's management prefers to
invest in equity securities or to acquire entire businesses based upon the principles discussed in the preceding section
on equity price risk. When unable to do so, management may alternatively invest in bonds or other interest rate sensitive
instruments. Berkshire's strategy is to acquire securities that are attractively priced in relation to the perceived credit
risk. Management recognizes and accepts that losses may occur. The Company has historically utilized a modest level
of corporate borrowings and debt. Further, Berkshire strives to maintain the highest credit ratings so that the cost of
debt is minimized. The Company does not actively utilize stand-alone derivatives to manage interest rate risks.
The fair values of Berkshire's fixed maturity investments and borrowings under investment agreements and
other debt will fluctuate in response to changes in market interest rates. Increases and decreases in prevailing interest
rates generally translate into decreases and increases in fair values of those instruments. Additionally, fair values of
interest rate sensitive instruments may be affected by the credit worthiness of the issuer, prepayment options, relative
values of alternative investments, the liquidity of the instrument and other general market conditions.
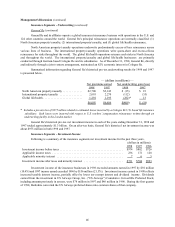
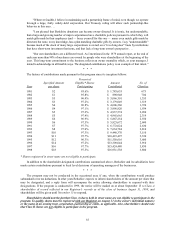
The table below summarizes the estimated effects of hypothetical increases and decreases in interest rates on
assets and liabilities that are subject to interest rate risk. It is assumed that the changes occur immediately and uniformly
to each category of instrument containing interest rate risks. The hypothetical changes in market interest rates do not
reflect what could be deemed best or worst case scenarios. The hypothetical fair values are based upon the same
prepayment assumptions utilized in computing fair values at year-end 1998 and 1997. Significant variations in market
interest rates could produce changes in the timing of repayments due to prepayment options available. For these reasons,
actual results might differ from those reflected in the table which follows.
— (dollars in millions) —
Hypothetical Estimated
Change in Fair Value after
Interest Rate Hypothetical Change
Fair Value (bp=basis points) in Interest Rate
As of December 31, 1998
Investments in securities with fixed maturities ...
(1) $20,891 100 bp decrease $21,774
100 bp increase 19,974
200 bp increase 19,093
300 bp increase 18,130
Borrowings under investment agreements and other
debt ..................................
(2) 1,986 100 bp decrease 2,095
100 bp increase 1,865
200 bp increase 1,768
300 bp increase 1,681
As of December 31, 1997
Investments in securities with fixed maturities ...
(1) 9,018 100 bp decrease 10,283
100 bp increase 7,857
200 bp increase 7,074
300 bp increase 6,416
Borrowings under investment agreements and other
debt ..................................
(2) 1,482 100 bp decrease 1,535
100 bp increase 1,410
200 bp increase 1,354
300 bp increase 1,303
Excludes redeemable convertible preferred stocks (See Equity Price Risk)
(1)
Excludes 1% Senior Exchangeable Notes (See Equity Price Risk)
(2)