Berkshire Hathaway 1998 Annual Report Download - page 12
Download and view the complete annual report
Please find page 12 of the 1998 Berkshire Hathaway annual report below. You can navigate through the pages in the report by either clicking on the pages listed below, or by using the keyword search tool below to find specific information within the annual report.-
 1
1 -
 2
2 -
 3
3 -
 4
4 -
 5
5 -
 6
6 -
 7
7 -
 8
8 -
 9
9 -
 10
10 -
 11
11 -
 12
12 -
 13
13 -
 14
14 -
 15
15 -
 16
16 -
 17
17 -
 18
18 -
 19
19 -
 20
20 -
 21
21 -
 22
22 -
23
-
24
-
25
-
26
-
27
-
28
-
29
-
30
-
31
-
32
-
33
-
34
-
35
-
36
-
37
-
38
-
39
-
40
-
41
-
42
-
43
-
44
-
45
-
46
-
47
-
48
-
49
-
50
-
51
-
52
-
53
-
54
-
55
-
56
-
57
-
58
-
59
-
60
-
61
-
62
-
63
-
64
-
65
-
66
-
67
-
68
-
69
-
70
-
71
-
72
-
73
-
74
 |
 |

11
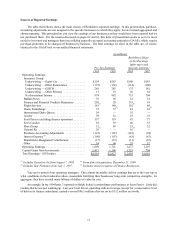
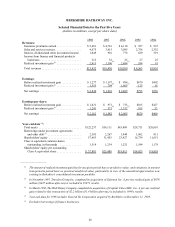
Sources of Reported Earnings
The table that follows shows the main sources of Berkshire's reported earnings. In this presentation, purchase-
accounting adjustments are not assigned to the specific businesses to which they apply, but are instead aggregated and
shown separately. This procedure lets you view the earnings of our businesses as they would have been reported had we
not purchased them. For the reasons discussed on pages 62 and 63, this form of presentation seems to us to be more
useful to investors and managers than one utilizing generally-accepted accounting principles (GAAP), which require
purchase-premiums to be charged off business-by-business. The total earnings we show in the table are, of course,
identical to the GAAP total in our audited financial statements.
(in millions)
Berkshire’s Share
of Net Earnings
(after taxes and
Pre-Tax Earnings minority interests)
1998 1997 1998 1997
Operating Earnings:
Insurance Group:
Underwriting — Super-Cat .................. $154 $283 $100 $183
Underwriting — Other Reinsurance ........... (175)(155)(114)(100)
Underwriting — GEICO .................... 269 281 175 181
Underwriting — Other Primary ............... 17 53 10 34
Net Investment Income ..................... 974 882 731 704
Buffalo News .............................. 53 56 32 33
Finance and Financial Products Businesses ....... 205 28 133 18
Flight Services ............................. 181 140 110 84
(1) (1)
Home Furnishings .......................... 72 57 41 32
(2) (2)
International Dairy Queen .................... 58 — 35 —
Jewelry .................................. 39 32 23 18
Scott Fetzer (excluding finance operation) ........ 137 119 85 77
See’s Candies ............................. 62 59 40 35
Shoe Group ............................... 33 49 23 32
General Re ............................... 26 — 16 —
(3) (3)
Purchase-Accounting Adjustments ............. (123)(101)(118)(94)
Interest Expense ..........................
(4) (100)(107)(63)(67)
Shareholder-Designated Contributions .......... (17)(15)(11)(10)
Other .................................... 34 60 29 37
Operating Earnings .......................... 1,899 1,721 1,277 1,197
Capital Gains from Investments ................. 2,415 1,106 1,553 704
Total Earnings - All Entities ................... $4,314 $2,827 $ 2,830 $1,901
Includes Executive Jet from August 7, 1998 . From date of acquisition, December 21, 1998.
(1) (3)
Includes Star Furniture from July 1, 1997. Excludes interest expense of Finance Businesses.
(2) (4)
You can be proud of our operating managers. They almost invariably deliver earnings that are at the very top of
what conditions in their industries allow, meanwhile fortifying their businesses’ long-term competitive strengths. I n
aggregate, they have created many billions of dollars of value for you.
An example: In my 1994 letter, I reported on Ralph Schey’s extraordinary performance at Scott Fetzer. Little did
I realize that he was just warming up. Last year Scott Fetzer, operating with no leverage (except for a conservative level
of debt in its finance subsidiary), earned a record $96.5 million after-tax on its $112 million net worth.