Berkshire Hathaway 1998 Annual Report Download - page 48
Download and view the complete annual report
Please find page 48 of the 1998 Berkshire Hathaway annual report below. You can navigate through the pages in the report by either clicking on the pages listed below, or by using the keyword search tool below to find specific information within the annual report.-
 1
1 -
2
-
3
-
4
-
5
-
6
-
7
-
8
-
9
-
10
-
11
-
12
-
13
-
14
-
15
-
16
-
17
-
18
-
19
-
20
-
21
-
22
-
23
-
24
-
25
-
26
-
27
-
28
-
29
-
30
-
31
-
32
-
33
-
34
-
35
-
36
-
37
-
 38
38 -
 39
39 -
 40
40 -
 41
41 -
 42
42 -
 43
43 -
 44
44 -
 45
45 -
 46
46 -
 47
47 -
 48
48 -
 49
49 -
 50
50 -
 51
51 -
 52
52 -
 53
53 -
 54
54 -
 55
55 -
 56
56 -
 57
57 -
 58
58 -
59
-
60
-
61
-
62
-
63
-
64
-
65
-
66
-
67
-
68
-
69
-
70
-
71
-
72
-
73
-
74
 |
 |

47
Management's Discussion (Continued)
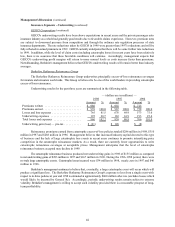
Insurance Segments - Investment Income (continued)
Berkshire’s insurance businesses continue to generate significant levels of investment income from
maintaining large levels of invested assets. The acquisition of General Re at the end of 1998 increased invested assets
by about $25 billion. Increases in invested assets in recent years also derive from reinvested earnings and additional
capital contributions, as well as increases in the amounts of "float". Reinvested earnings and capital contributions over
the three year period ending December 31, 1998 were approximately $6 billion. Float represents the sum of unpaid
losses and loss expenses, unearned premiums, and other liabilities to policyholders less the aggregate of premiums and
reinsurance balances receivable, deferred policy acquisition costs, deferred charges re reinsurance assumed and related
prepaid income taxes. Total float was approximately $22.8 billion at year end 1998 which includes $14.9 billion
assumed as a result of the General Re acquisition.
Income tax expense as a percentage of investment income before taxes was 24.2% in 1998, 19.5% in 1997
and 17.6% in 1996. Investment income in each of these years includes substantial amounts of interest on municipal
obligations and dividends from equity investments that are effectively taxed at rates below the full statutory federal
rate.
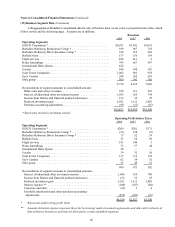
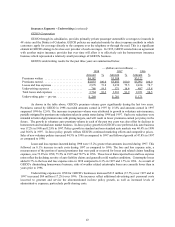
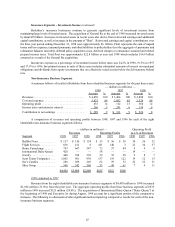
Non-Insurance Business Segments
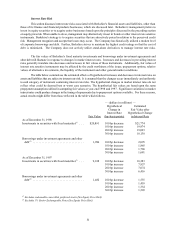
A summary follows of results to Berkshire from these identified business segments for the past three years.
— (dollars in millions) —
1998 1997 1996
Amount %Amount %Amount %
Revenues ................................. $ 4,458 100 $ 3,404 100 $ 2,888 100
Cost and expenses .......................... 3,823 86 2,892 85 2,528 88
Operating profit ............................ 635 14 512 15 360 12
Income taxes and minority interest ............. 246 5 201 6 134 4
Contribution to net earnings .................. $ 389 9 $ 311 9 $ 226 8
A comparison of revenues and operating profits between 1998, 1997 and 1996 for each of the eight
identifiable non-insurance business segments follows.
— (dollars in millions) — Operating Profit
Revenues Operating Profits as a % of Revenues
Segment 1998 1997 1996 1998 1997 1996 1998 1997 1996
Buffalo News ........... $ 157 $ 156 $ 154 $ 53 $ 56 $ 50 34 36 32
Flight Services .......... 858 411 8 181 140 3 21 34 37
Home Furnishings ....... 793 667 587 72 57 44 9 9 8
International Dairy Queen 420 — — 58 — — 14 — —
Jewelry ............... 440 398 392 39 32 28 9 8 7
Scott Fetzer Companies ... 1,002 961 938 137 119 122 14 12 13
See’s Candies .......... 288 269 249 62 59 52 22 22 21
Shoe Group ............ 500 542 560 33 49 61 7 9 11
$4,458 $3,404 $2,888 $635 $512 $360
1998 compared to 1997
Revenues from the eight identifiable non-insurance business segments of $4,458 million in 1998 increased
$1,054 million (31.0%) from the prior year. The aggregate operating profits from these business segments of $635
million in 1998 increased $123 million (24.0%). The acquisitions of International Dairy Queen (“Dairy Queen”) at
the beginning of 1998 and Executive Jet during August, 1998 account for a significant portion of the comparative
increases. The following is a discussion of other significant matters impacting comparative results for each of the non-
insurance business segments.